The Relationship between Regular Use of Ridesourcing and Frequency of Public Transport Use in the MENA Region (Tehran and Cairo)


1
Mobility Research Cluster, Department of Work, Technology and Participation, Technische Universität Berlin, 10587 Berlin, Germany
2
Center for Technology and Society, Technische Universität Berlin, 10623 Berlin, Germany
3
Department of Transport and Supply Chain Management, College of Business and Economics, University of Johannesburg, Johannesburg 2006, South Africa
*
Author to whom correspondence should be addressed.
Sustainability 2020, 12(19), 8134; https://doi.org/10.3390/su12198134
Submission received: 24 July 2020
/
Revised: 29 September 2020
/
Accepted: 30 September 2020
/
Published: 2 October 2020
(This article belongs to the Special Issue Transitions to Sustainable Urban Mobility in Global South Cities: Challenges, Innovations and Opportunities)
Abstract
:Despite the growing share of ridesourcing services in cities, there is limited research about their impacts on other transport mode choices in the large cities of the Middle East and North Africa (MENA). There is a debate about whether ridesourcing affects the frequent use of sustainable modes like public transport. This study uses the results of a large-scale series of face-to-face interviews in Tehran and Cairo to study the relationship between the regular use of ridesourcing and the frequency of public transport use. Descriptive statistics and logit regression are used to analyze this association. The findings indicate contradictory correlations between the regular use of ridesourcing and the frequent use of public transport in Tehran and Cairo. The regular use of ridesourcing has a positive correlation with the probability of frequent public transport use in Cairo. In contrast, this correlation is negative in Tehran, which means that the regular ridesourcing users are less likely than the non-regular users to use frequently public transport. The reasons for these different correlations are studied in terms of socioeconomic variables, accessibility, and the citizens’ perception of public transport in both cities.
1. Introduction
With the emergence of smart transport modes like ridesourcing in cities of the global south like the region of the Middle East and North Africa (MENA), it is essential to study their impacts on the mobility behaviors of the citizens. This paper studies the association between the regular use of ridesourcing and the frequency use of public transport in two large MENA cities, which are Tehran in Iran and Cairo in Egypt.
Information and communications technology (ICT) influences the trip generation, travel purposes, and costs by changing the concept of connectivity and distance and causing related adjustments in individual and social lifestyles [1,2,3,4]. ICTs have formed new shapes of the mobility modes like ridesourcing and ridesharing, which connect the main components of the transport system (travelers, transport mode, transport facilities) systematically through online platforms to provide real-time and efficient mobility services.
Ridesourcing (also known as ride-hailing or transportation network company (TNC) services) provides mobility services for travelers who request a ride by online platforms like smartphone apps and assigns the nearest drivers to travelers. Ridesourcing improves the availability of vehicles in real-time and appropriate locations by matching the locations of drivers and travelers through GPS and online platforms. Moreover, ridesourcing offers passengers more services like e-payment, selecting a car class and rating, and reviewing drivers. Rayle et al. defined this new transport service as ridesourcing because travelers can “source” a ride from a driver pool [5]. Unlike traditional car travel by private cars or traditional taxies, ridesourcing increases the functional and financial efficiency of car travel. Ridesourcing and ridesharing have the potential to impact the emissions of urban transport and, consequently, the urban environment by changing car ownership in the cities [6,7,8,9]. However, traffic congestion and transport difficulties are commonplace in big cities, as a result of high car dependence [10]. There is a concern that ridesourcing encourages citizens to shift from their sustainable travel modes, like public transport, to the car travel by offering relatively convenient door to door services. This would cause an increase in vehicle-kilometers traveled (VKTs) and, consequently, the traffic congestion in the cities. There is an argument that ridesourcing causes the Jevons paradox, which means its operational efficiencies may increase rather than decrease car usage and overall VKTs in cities [11]. William Stanley Jevons (a 19th-century economist) explained that improvements in the efficiency of consumption might increase instead of decrease the amount of consumption. This might happen because of rebound effects that offset the expected savings through efficient technologies [12,13]. Ridesourcing uses cars efficiently because it decreases deadheading kilometers, which also decreases the cost per person-kilometer. This cost reduction may increase in car travel demand, which is a rebound effect. Because, although it is expected that ridesourcing reduces VKT by its efficiency, it increases car travel demand, and consequently, it increases the total VKT. Rayle et al. indicated that 8% of ridesourcing users would not have traveled if ridesourcing services had not been available in San Francisco [14]. Henao (2017) found that 12.2% of ridesourcing trips in Denver would not have been taken if Uber and Lyft had not been available [15]. Clewlow and Mishra reported that ridesourcing might increase vehicle miles traveled in seven big American cities [16]. Moreover, some literature suggests that ridesourcing has both complementary and supplementary effects on public transport in the countries of the global north [12,17]. As complementary effects, ridesourcing bridges the temporal and spatial gap in public transport. For example, the American Public Transportation Association (APTA) reported that ridesourcing was more often used during weekends and late nights when public transport was less available [18]. Moreover, ridesourcing might solve the first mile/last mile problems of public transport by improving its accessibility and availability [17]. However, ridesourcing could compete with public transport, particularly in large cities. Rayle et al. indicated that in San Francisco, 33% of the ridesourcing users would have taken public transport if ridesourcing services like Uber and Lyft were not available [14]. Henao (2017) found that 22.2% of the ridesourcing users in Denver would have traveled by public transport if Lyft/Uber were not available [15]. Clewlow and Mishra indicated that ridesourcing attracts people from the public bus and light rail [16]. Regarding these different studies in the global north context, there is a possibility that the adaptation of ridesourcing as a regular mobility mode may cause a new form of car dependence with a lower tendency toward public transport use. It is essential to study how ridesourcing affects the frequency of public transport use to understand the association between ridesourcing and car dependence. There is extensive literature on the relation between car dependence and public transport [19,20,21]. The term “car dependency” is characterized by different levels, such as macro and micro [22]. The macro-level refers to high amounts of automobile travel per capita and automobile-oriented land use [23]. The micro-level describes the level of private car use [24,25]. Some researchers emphasize a significant correlation between car dependency and car ownership, even in public-transport-dominated cities. Cullinane (2003) indicated that in Hong Kong, once people buy a car, despite the availability of good public transport networks, they remark it to be an essential part of their lifestyle [26]. Although the major reasons for car purchases are to save time, as well as carry things, cars are used for all travel purposes regardless of the need to carry things. In addition, some researchers have studied the psychometric parameters of car-dependent travelers, and they indicated that regular car use is strongly correlated with the intrinsic psychometric characteristics of travelers rather than the attributes of mobility modes. For example, frequently, car use is associated with feelings of independence and convenience [27,28,29]. As it was mentioned, the impacts of ridesourcing on mode choice behaviors of citizens have been studied in the global north cities but less in agglomerations of the global south countries. In Cairo and Tehran, ridesourcing is developing with a sharp growth rate. Uber reported that it had 4 million users and 157,000 drivers in Egypt in 2017 [30]. In Iran, the ridesourcing sector has encountered a market boom since the first online ride-hailing company called “Snapp” launched in 2014. In 2016, Snapp had 0.5 million users and 120,000 active drivers with 70% growth in rides per month in Tehran [31,32]. These figures indicate the potential impact of these new travel modes on travel behaviors in Cairo and Tehran.
This paper tries to shed light on the knowledge gap, which is how the regular use of ridesourcing impacts the probability of public transport use in Cairo and Tehran. Therefore, the main objective of this paper is to study whether there is a significant difference in the probability of frequent public transport use between regular and non-regular users of ridesourcing. This study is based on the assumption that the frequent use of one transport mode affects mobility behaviors which influence other transport mode choices [33]. Therefore, a traveler type is defined as “regular ridesourcing users” who use ridesourcing as their regular mobility mode for at least one of their daily travel purposes. Then, their socioeconomic parameters (like age, gender, income) and their frequency of public transport use are compared with non-regular users. Moreover, we defined a binary variable “regular ridesourcing use” as the independent variable and a binary variable “frequent public transport use” as the dependent variable. Then, we used logistic regression to compare the odds of frequent public transport use between regular and non-regular users of ridesourcing. This analysis was done by using the data of the 4711 face-to-face surveys in Cairo and Tehran in 2017.
2. Materials and Methods
This study tries to answer three questions in Tehran and Cairo: (1) Are there significant differences in the socioeconomic variables of the regular and non-regular ridesourcing users? (2) Is there a significant correlation between the regular use of ridesourcing and the frequent use of public transport? (3) What are the main reasons for not using public transport among regular ridesourcing users?
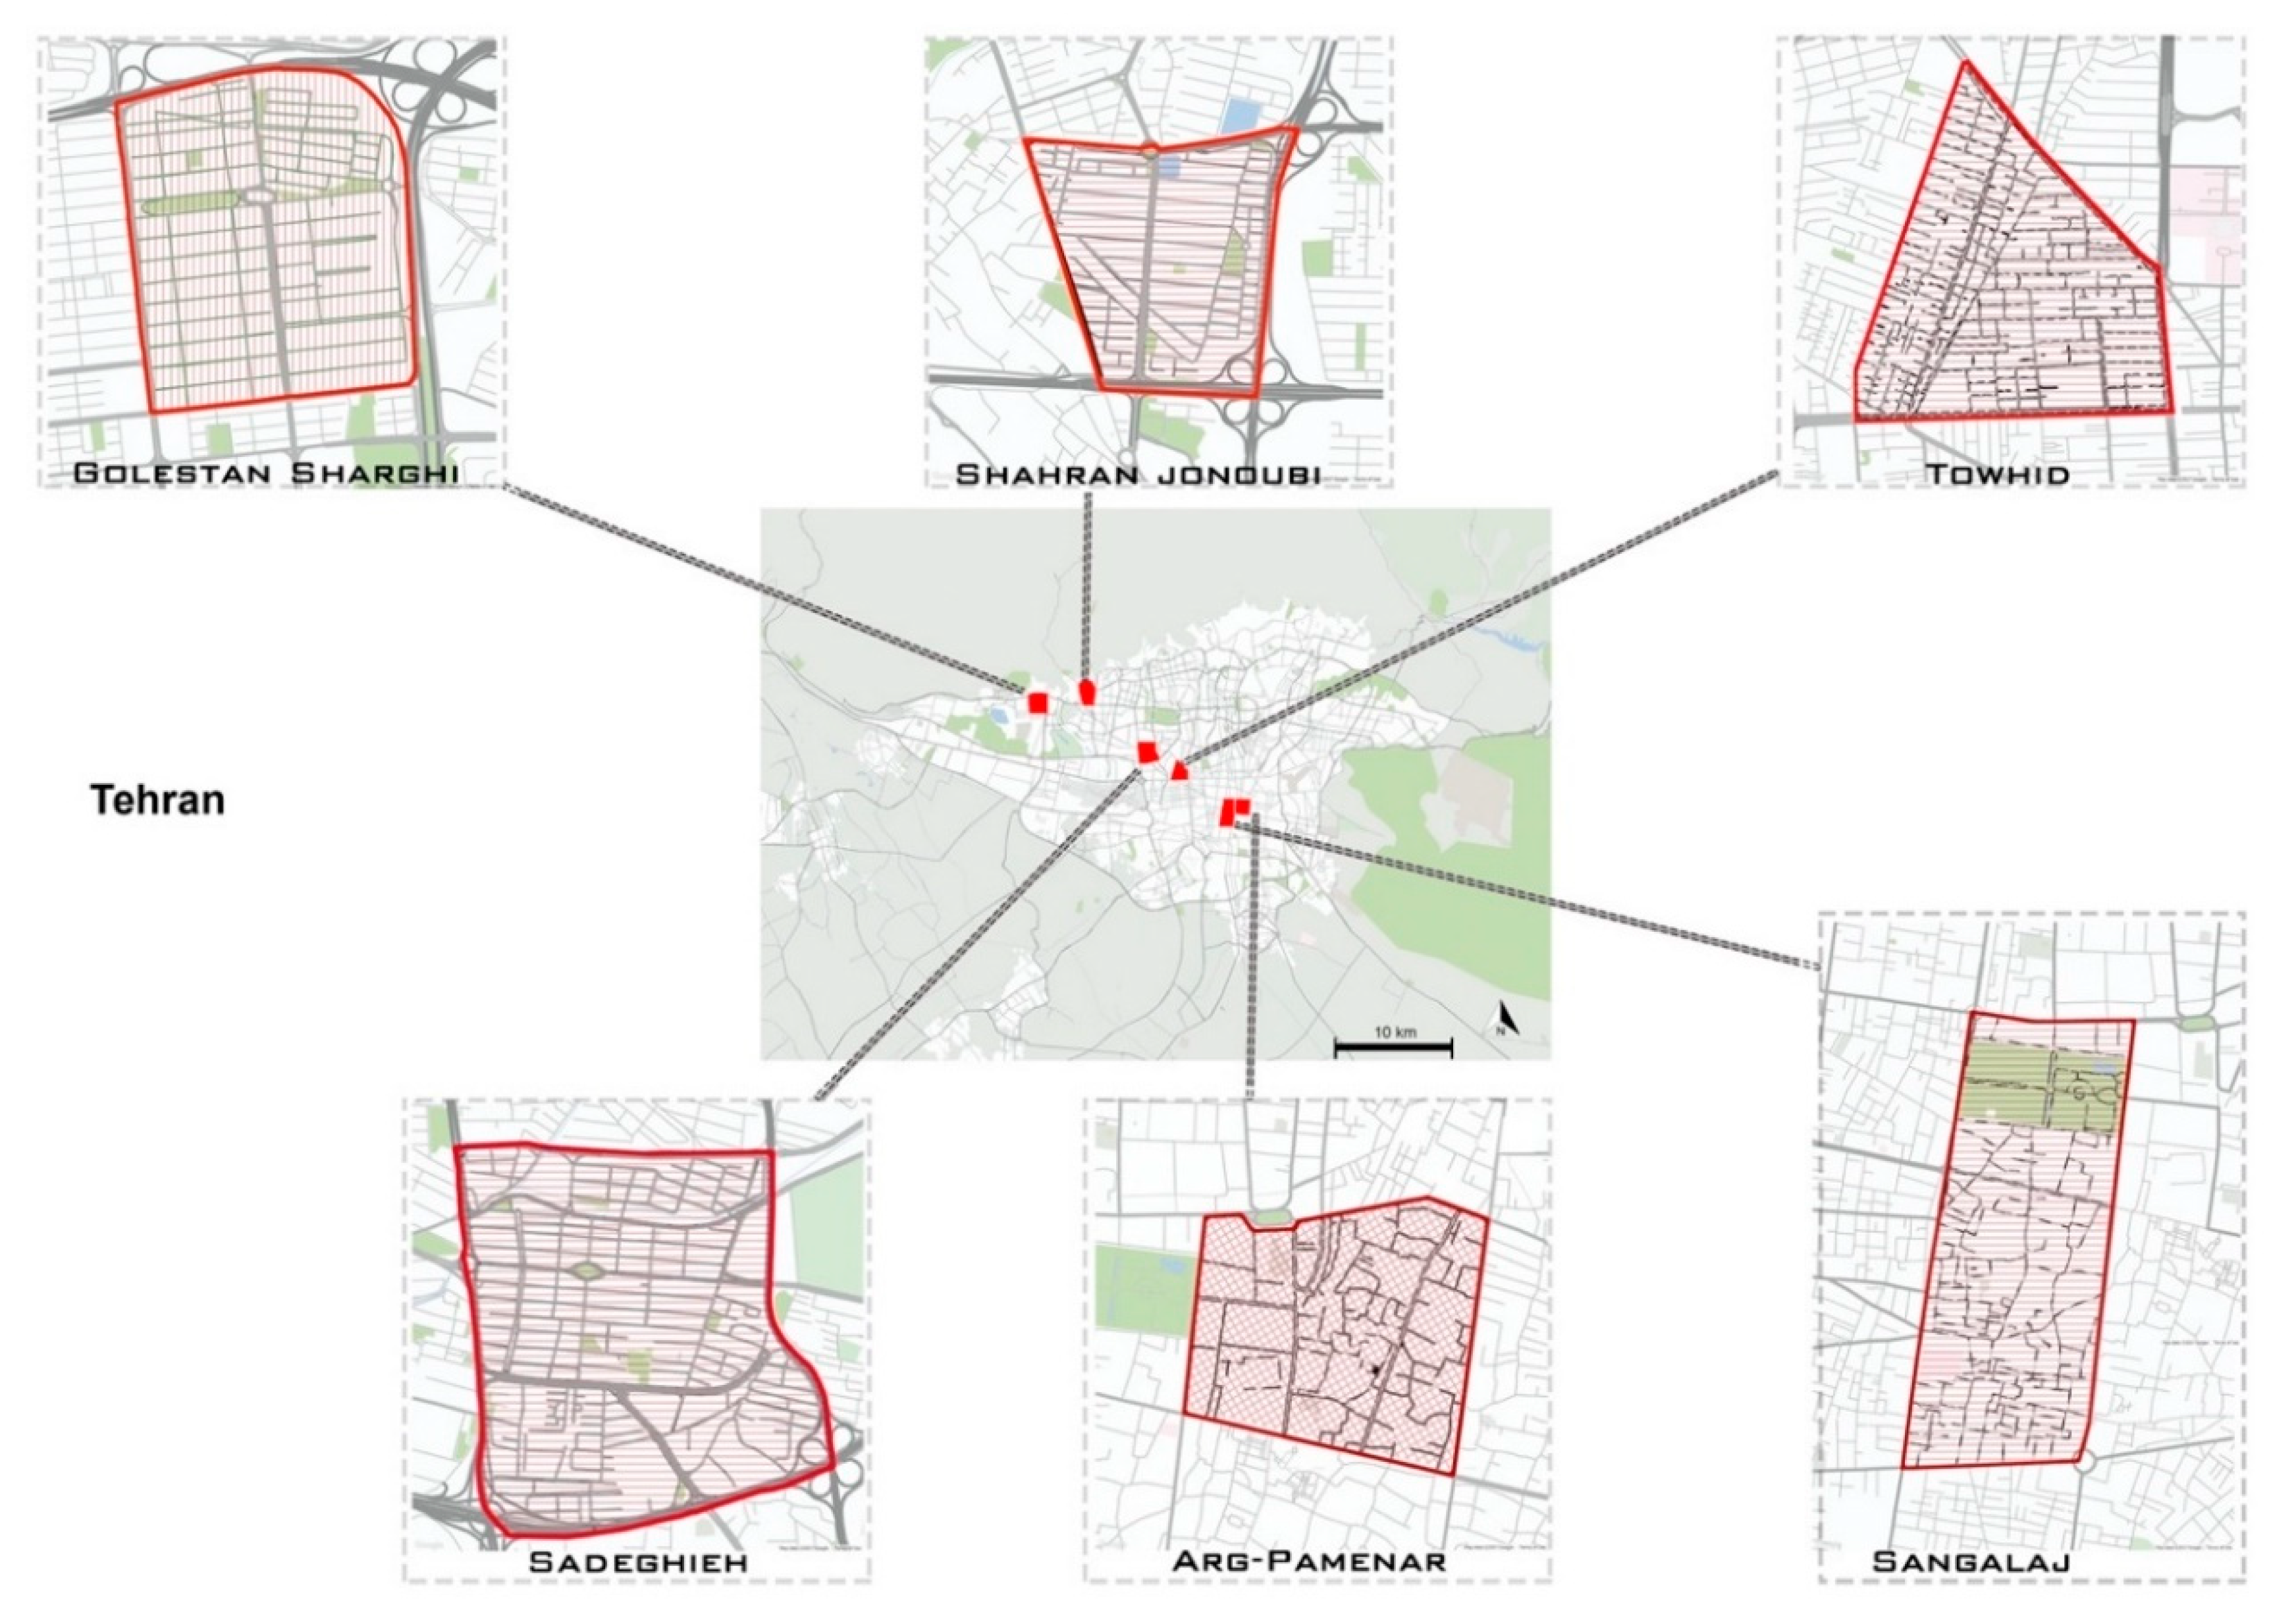
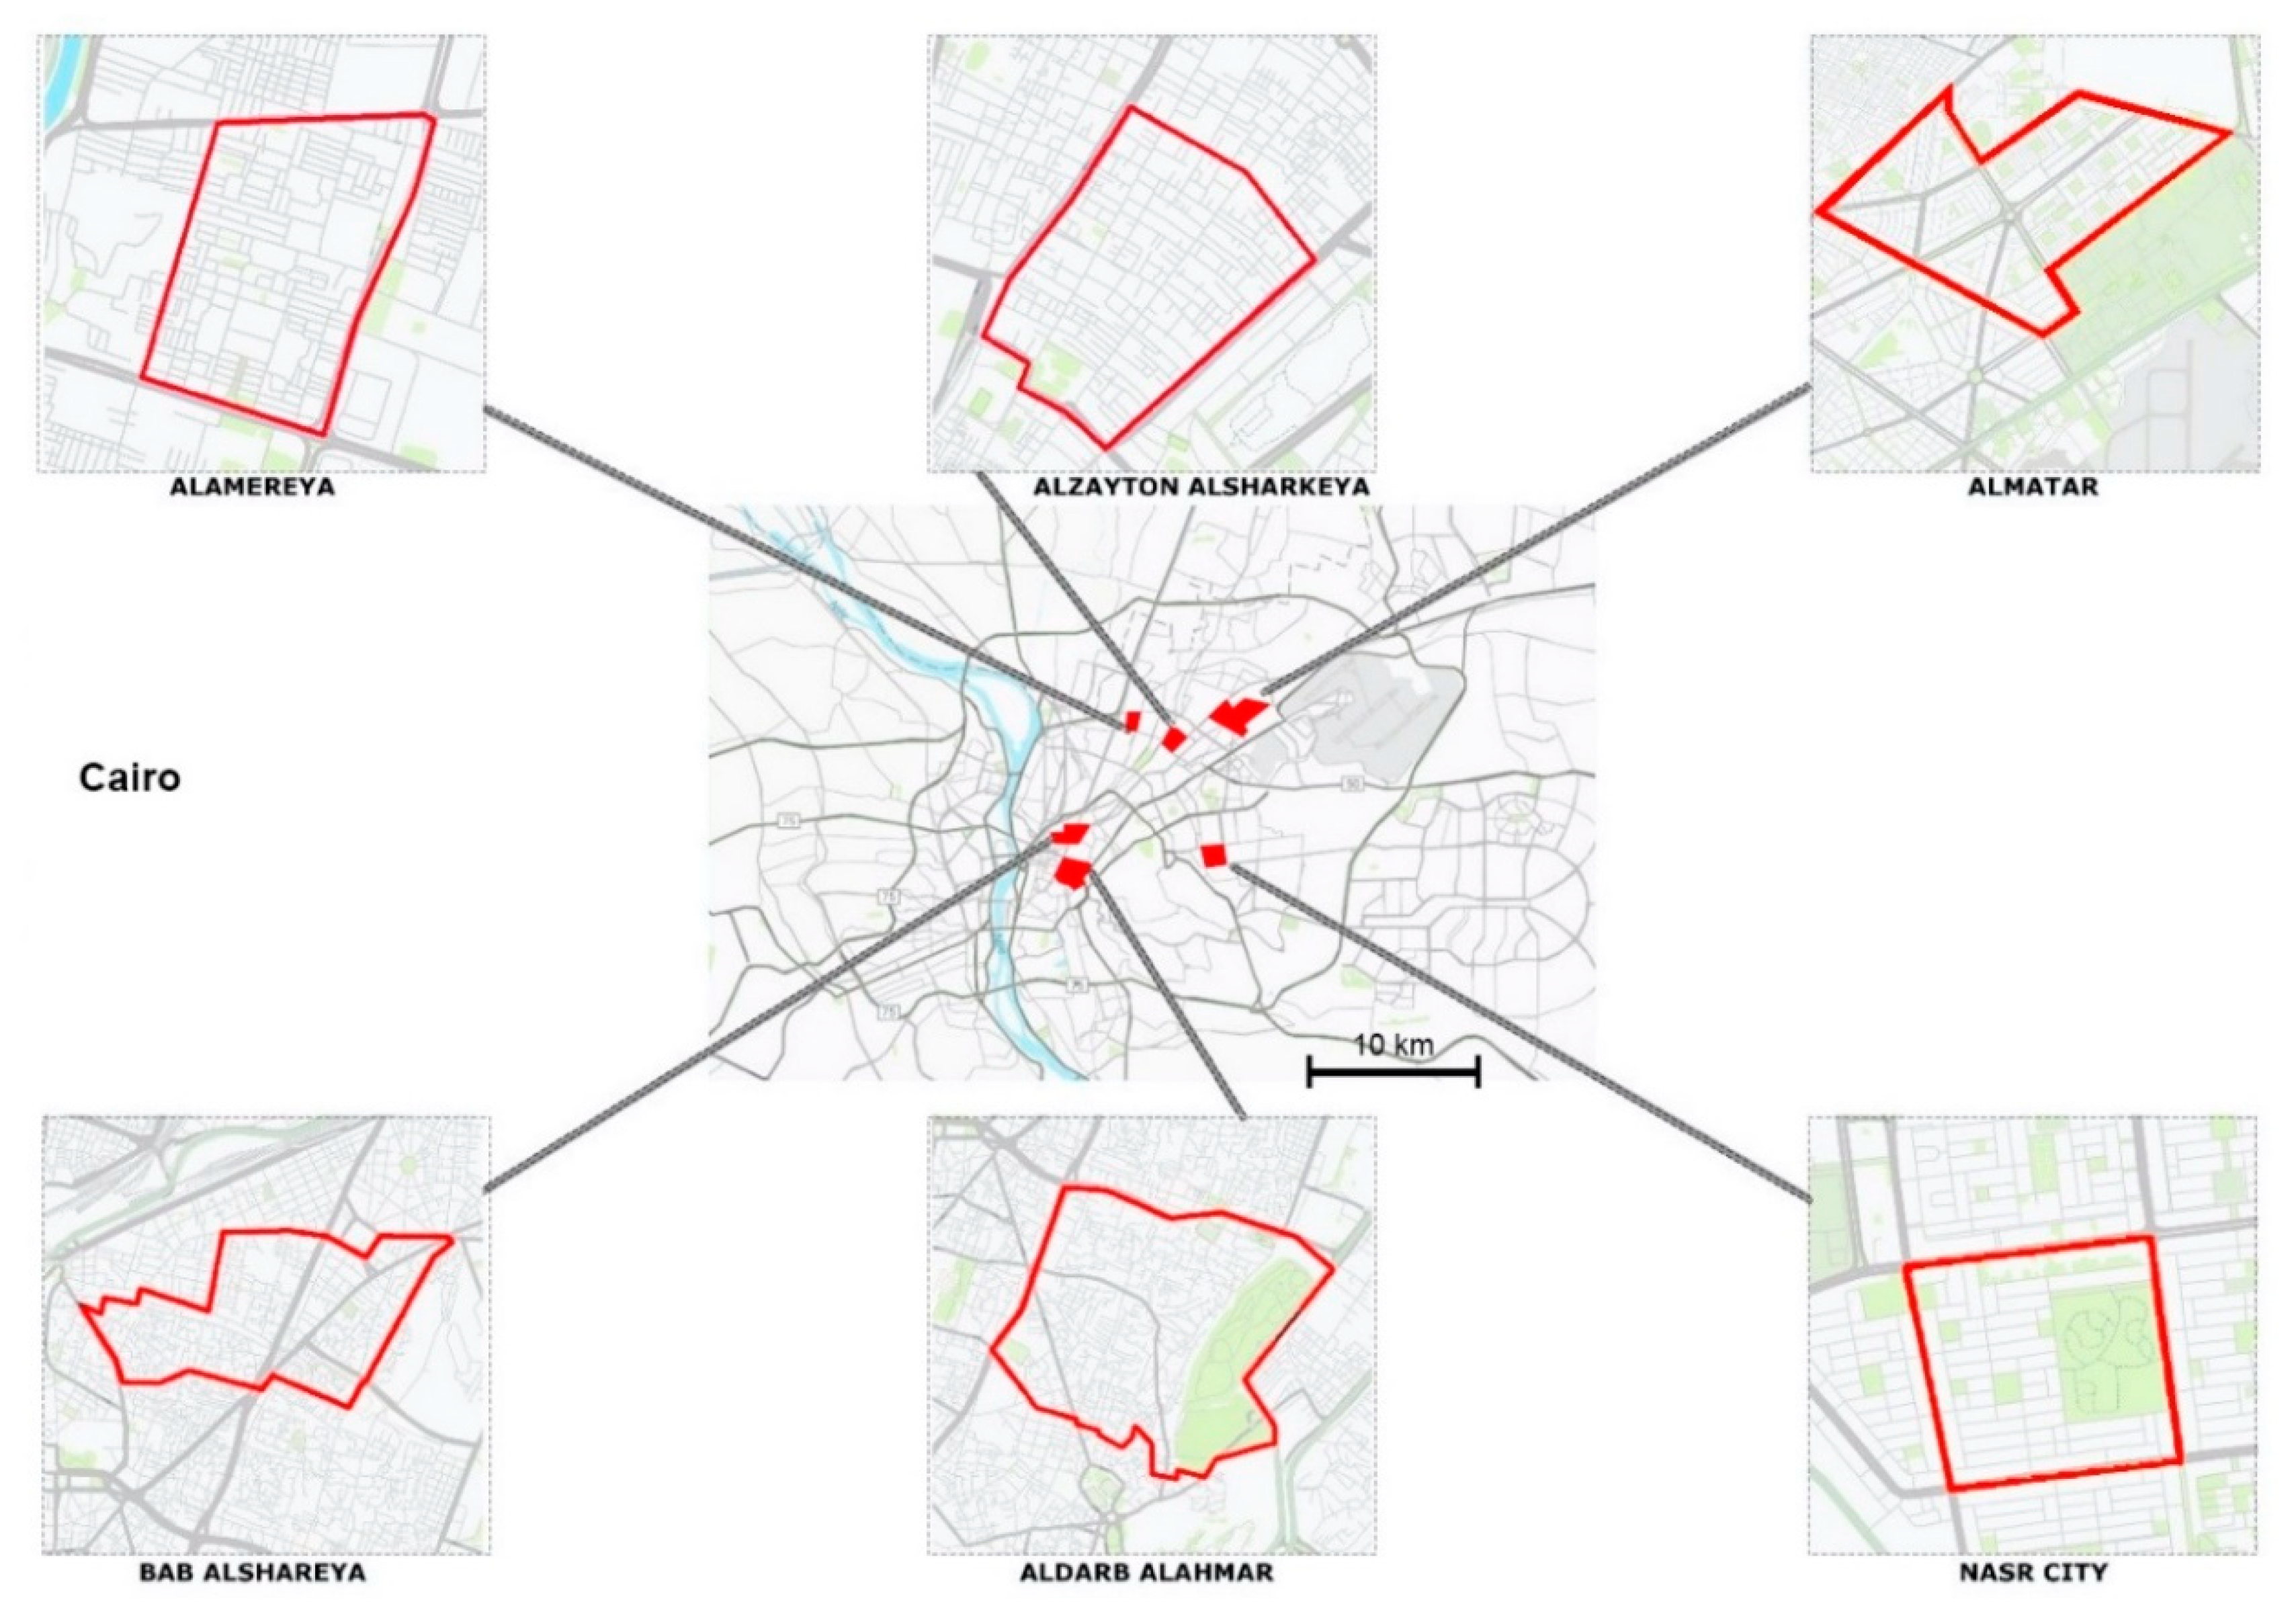
Regarding the literature review, the public transit ridership is affected by various factors: socioeconomic [34,35]; travel behavior; spatial [36,37,38,39]; and qualitative factors, such as comfort [40,41]. Therefore, the questionnaire was designed to contain the relevant factors to the public transport mode choice. The interviews were conducted in Tehran and Cairo in the spring and summer of 2017 in 12 neighborhoods. Regarding the study about the urban forms in Tehran and Cairo, the land use parameters and accessibility of public transport in these cities have an association with the periods of urban development [42]. This association indicates that the neighborhoods which have been developed recently have less accessibility to public transport than older neighborhoods. Therefore, to gather appropriate samples in two cities in terms of the accessibility-level of public transport, we selected six neighborhoods in each city in three different urban forms, which were developed in three different periods. For each city, three urban forms are newly developed (after 1980), old (historical), and in-between (transitional) urban forms. The old (historical) neighborhoods in Tehran and Cairo have a discernible center with a compact urban form and a high level of accessibility to the public transport modes like bus, minibus, and urban rail transits. In-between (transitional) urban forms were developed between 1930 and 1980 and have lower population density and compactness as well as less accessibility to public transportation than the old parts of Tehran and Cairo. The newly developed parts (after 1980) are centerless neighborhoods and located in the peripheral parts of Tehran and Cairo. They are more car-oriented neighborhoods with lower accessibility to public transportation than the other two urban forms. Therefore, the collected data were representative at the neighborhood level. Figure 1 and Figure 2 show the location of the selected neighborhoods in Tehran and Cairo, respectively. The full details of the survey have already been published [42]. The total sample size of this study is 4711 interviews, which includes 2456 for Tehran and 2255 for Cairo. The questions were organized into two main sections: socioeconomic variables and mobility behavior variables. The socioeconomic parameters in this survey include age, gender, monthly household income, monthly household living cost, number of household cars, and possession of a driving license. The monetary variables like income and living costs were asked in the currency of Egypt and Iran, and then the answers were converted to euros, based on the exchange rate of their central banks in 2017.
Based on the questions in the socioeconomic section, two additional variables were defined as the household income–living cost ratio and the household car–driving license ratio. The household income–living cost ratio indicates the economic situation of the households as well as the savings of the households and their flexibility to adopt new living costs. The car–driving license ratio is the number of household cars divided by the number of household members who have a driving license, which shows the accessibility of a car for the respondents. The mobility behavior section includes three subsections: (1) the work/study trips and their main mobility mode; (2) the nonwork/study trips, including trips inside and outside of the respondents’ neighborhood, and the regular mobility mode for each of them; and (3) the frequency of public transport use and the reasons for not using public transport modes.
For the questions about the main mobility mode, the interviewees were asked to select only one option as their regular mode for each of the mentioned travel mode. In this study, public transport mode includes public bus, minibus, metro, light rail train, and tram. The frequency of public transport use was asked by the question “How often do you use public transit? “with five options: every day, a few times per week, a few times per month, rarely, and almost never. We dichotomized the answers into “frequent use” with the code 1 for responses of “every day, a few times per week,” and non-frequent with code 0 for responses of “a few times per month, rarely, and almost never”.
2.1. Traveler Types
A categorical variable “ridesourcing use” was defined to categorize the respondents into two categories: (1) regular ridesourcing users and (2) non-regular ridesourcing users. The category of regular ridesourcing users is defined as the travelers who regularly use ridesourcing as their main mode for at least one of their everyday travel purposes. This study focuses on three common travel purposes: commuting to work/study, nonwork/study trips inside the neighborhood, and nonwork/study trips outside the neighborhood. Another category is defined as non-regular ridesourcing users who do not use ridesourcing as their main mode for the three aforementioned common travel purposes. By this classification, the variable of ridesourcing use is defined as a binary categorical variable that is mutually exclusive and collectively exhaustive in both samples of Tehran and Cairo. This means that this variable categorized all observations of the samples in two groups of regular and non-regular users of ridesourcing, and there is no same observation in these two groups.
2.2. Analysis Methods
2.2.1. Comparison of the Demographic Variables between Regular and Non-Regular Users
Two hypotheses are about the significant correlation between the variable of ridesourcing use and two binary variables of gender and having household cars, separately, in the samples of Tehran and Cairo. We applied the Chi-square test of independence to test these hypotheses by two-sided p-values at significance level 0.05 and a confidence level of 95%. Furthermore, the continuous demographic parameters of the regular ridesourcing users are compared with the non-regular users to study the significant differences. We applied the Kolmogorov–Smirnov test to check whether the continuous variables (age, monthly household income, monthly household living cost, household income–living cost ratio) have a normal distribution. The test result for each of them shows a p-value lower than 0.001, which indicates that their distributions are not normal. Hence, the nonparametric tests like the Mann Whitney U test and the median test were used at significance level 0.05. The null hypothesis for the Mann Whitney U test is that the distribution of the mentioned variable is the same across two values (groups) of the variable “regular ridesourcing use”. The null hypothesis is defined for the median test that the medians of the given variable are the same among regular and non-regular users of ridesourcing.
2.2.2. Binary Logistic Regression
We employed binary logit regressions to compare the probability of frequent public transport use between regular ridesourcing users and non-regular users in Cairo and Tehran, separately, at confidence levels of 95%. The odds of frequent public transport use are defined as the dependent variable, which is the ratio of the probability of frequent use over the probability of not frequent public transport use. The conversion from probability to odds is a monotonic conversion, which means the odds decrease as the probability decreases or increase by the probability increases.
The independent variables were chosen to control possible confounding effects and to prevent high multicollinearity between independent variables. Therefore, the independent variables in the binary logit model are the regular ridesourcing, gender, age, household income–cost ratio, household car–driving license ratio, frequency of nonwork/study trips per week, and the average work/study trip distance per day. We checked the correlation matrix and the variance inflation factor (VIF) to examine whether there is a high risk of multicollinearity among independent variables. If a correlation coefficient between two independent variables is above 0.90, then it suggests high multicollinearity between these independent variables [43,44]. Moreover, Hair et al. (2010) suggested that multicollinearity is problematic if the VIF value is higher than 5 [44]. The values of VIF are less than 3.0 for the mentioned independent variables in the samples of Cairo and Tehran, which means that there is no high multicollinearity for this combination of independent variables.
The omnibus test was applied to evaluate whether the regression with the explanatory variables is an improvement over the baseline model without them. It uses a Chi-square test to check whether there is a significant difference between the log-likelihoods of the baseline and the model with the explanatory variables. We applied the Hosmer and Lemeshow test to evaluate the goodness of fit. The Pearson Chi-squared in this test examines the null hypothesis that the model is appropriately specified and fits the data well. If the p-value is less than 0.05, then we can reject this null hypothesis, which means the model is not accurately specified and does not fit the data well [45]. Moreover, the Cox and Snell R squared and the Nagelkerke R squared were calculated for each logit model of Tehran and Cairo.
3. Results
3.1. Demographic Profile
Among the 2255 interviews in Cairo, 151 respondents regularly use ride-sourcing services for at least one travel purpose among work/study travels, shopping, and entertainment travels inside and outside of living vicinity. Among 2456 interviews in Tehran, 88 respondents are classified as regular ridesourcing users. Table 1 and Table 2 show the socioeconomic parameters, including age, being employed/student, gender, household income, household living cost, household car ownership for regular and non-regular users of ridesourcing services in Cairo and Tehran.
For the Cairo sample, the Chi-square test of independence suggests that there is a significant correlation at 0.001 level (p < 0.001) between the dummy variable of regular ridesourcing use and gender. It means that women are significantly more likely to regularly use ridesourcing services than men in Cairo. Moreover, the Chi-square test of independence shows the significantly different car ownership rate between regular and non-regular resourcing in Cairo. Around 85% of regular users of ridesourcing have at least one car in their households, while 67% of non-regular users have a household car. Furthermore, the results of the Mann Whitney U test reject the null hypothesis for age, household income, household living cost, and the household income–cost ratio at 0.001 level (p < 0.001). Furthermore, the nonparametric median test shows that the aforementioned continuous variables have significantly different medians for regular and non-regular users of ridesourcing at 0.001 level (p < 0.001). The median and mean of regular users’ age are 25.0 and 27.9, respectively, which are significantly lower than non-regular users. Moreover, the median of the household incomes of regular users (9000 euros) is significantly higher than non-regular users (6000 euros).
These findings suggest that regular users of ridesourcing are younger with higher household income than non-regular users in Cairo.
Table 2 indicates the demographics of the regular and non-regular users of ridesourcing in Tehran. The Chi-square test of independence shows that there is a significant correlation at 0.05 level (p < 0.05) between the dummy variables of regular ridesourcing use and gender. Therefore, Tehranian women regularly use ridesourcing significantly more than men. Moreover, the Chi-square test of independence shows the significant different car ownership rates between regular and non-regular resourcing in Tehran at the 0.01 level (p < 0.01). Around 98% of regular ridesourcing users have at least one household car, while 89.4% of non-regular users have a household car. Like the sample of Cairo, the results of the Mann Whitney U test reject the null hypothesis for household income and household living cost at 0.001 level (p < 0.001). Moreover, the median test shows that the medians of these aforementioned variables are significantly different between regular and non-regular users of ridesourcing. However, these tests do not reject null hypotheses for the variable of age at 0.05 level. Therefore, unlike the Cairo sample, the median age of regular users is not different from non-regular users. Moreover, the median of the household incomes of regular users (1403 euros) is significantly higher than non-regular users (1169 euros).
3.2. Frequency of Public Transport Use
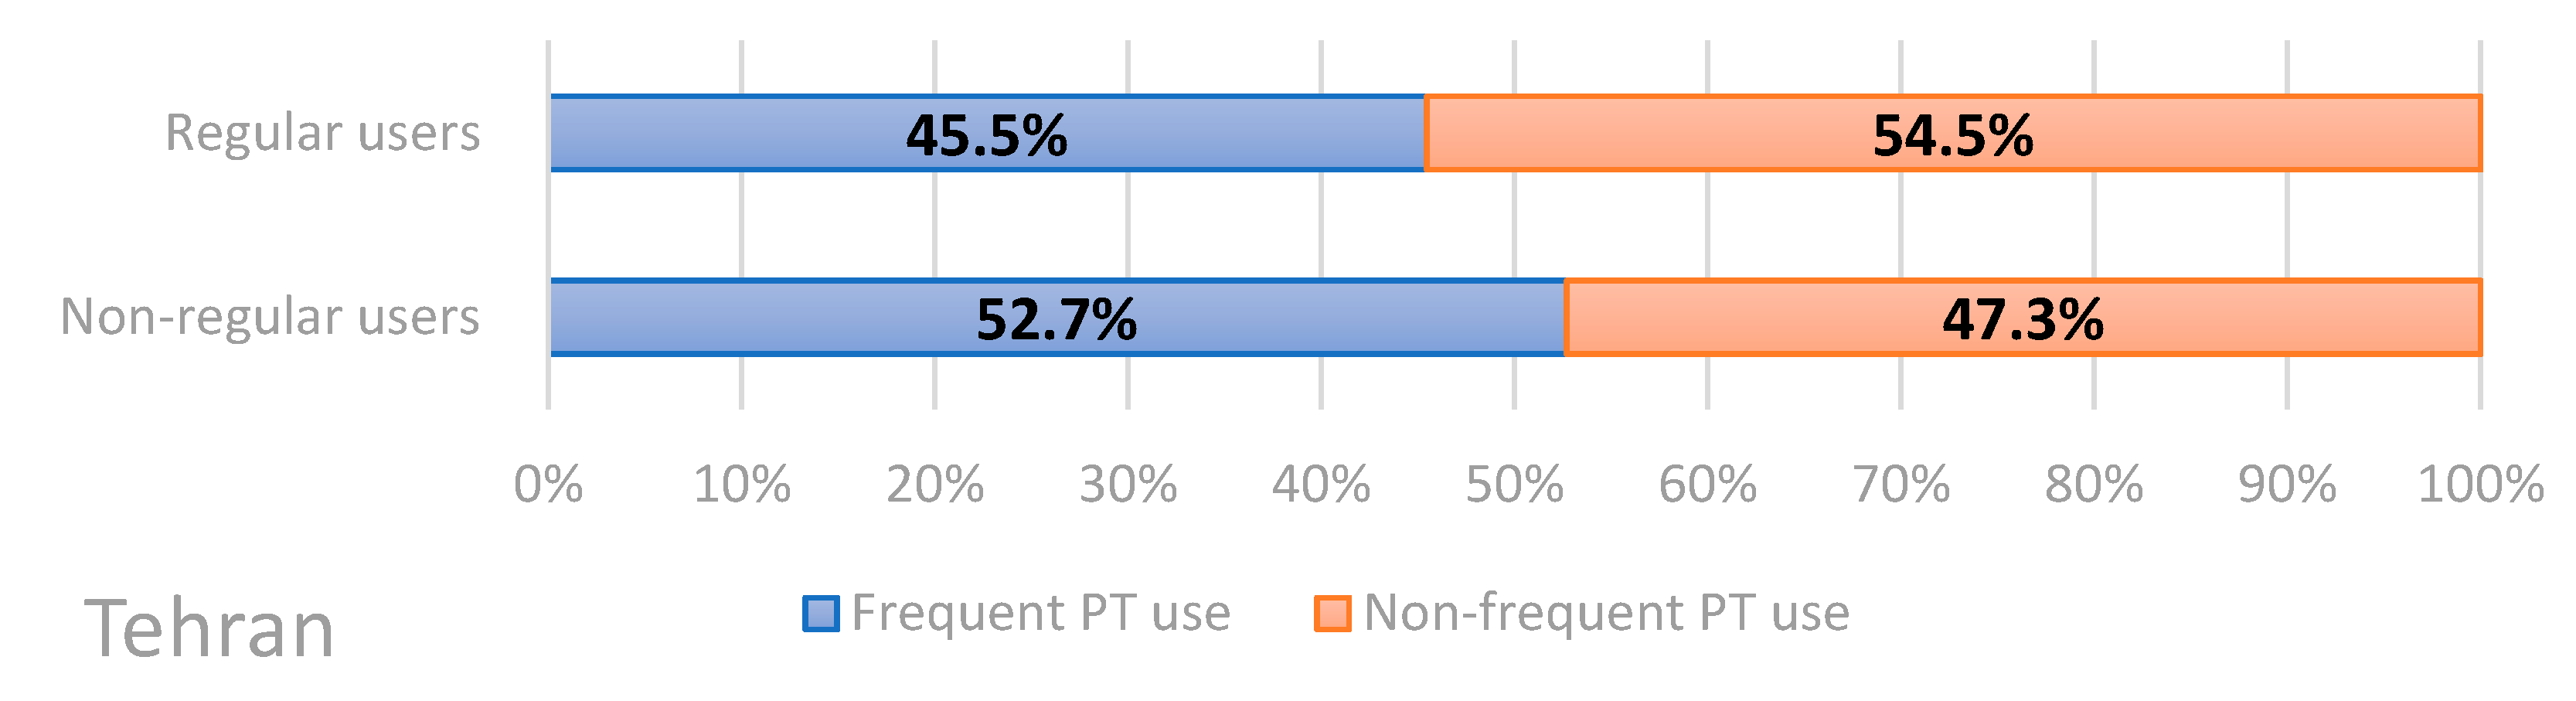
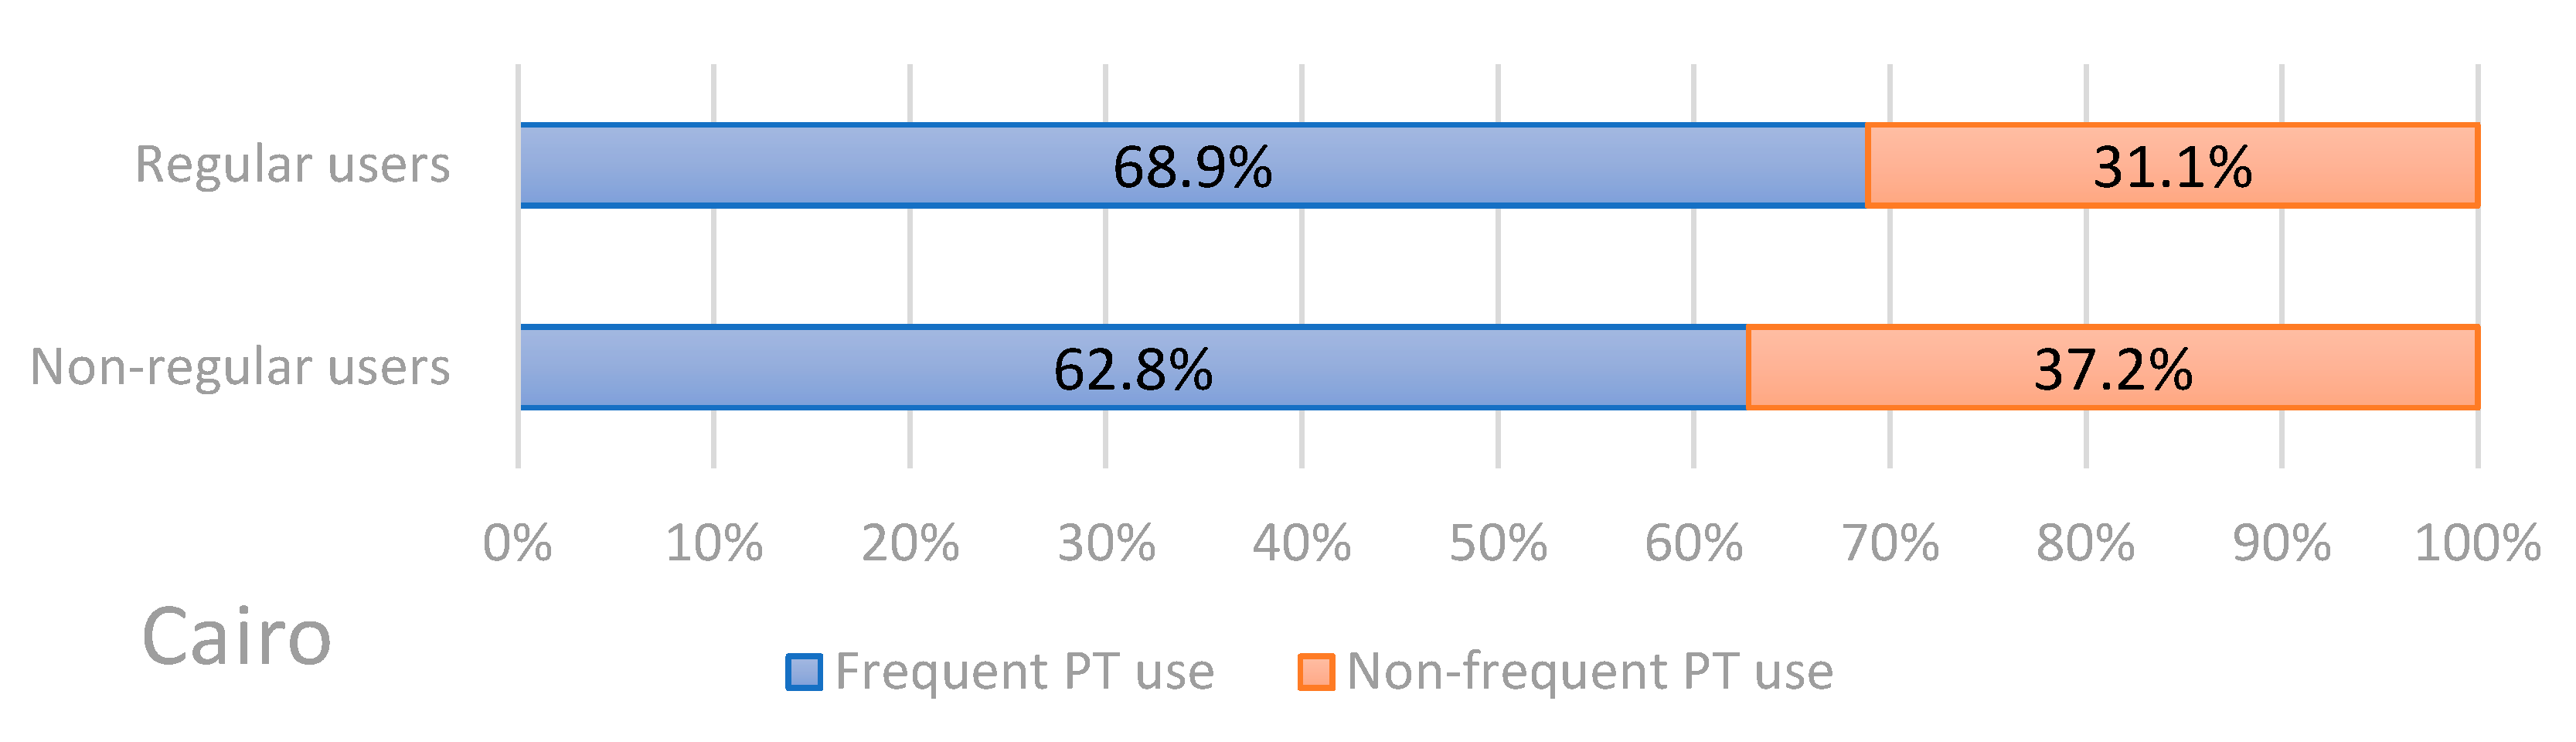
We asked the respondents how often they use public transport to compare the frequency of use of public transport between regular and non-regular users of ridesourcing. As it is explained, the answers to this question are dichotomized into frequent and non-frequent use of public transport. The results of this question are shown in Figure 3 and Figure 4 for Tehran and Cairo, respectively. In Tehran, 45.5% of regular ridesourcing users use public transport frequently, and 54.5% use this mobility mode almost never, rarely, or a few times per month; 52.7% of non-regular ridesourcing users use public transport frequently (every day or a few times per week), which means non-regular users of ridesourcing are more frequent users of public transport than regular ridesourcing users. The result of this question for the Cairo sample is in contrast with the Tehran sample. Regular ridesourcing users use public transport frequently (68.9%), more than non-regular ridesourcing users (62.8%). Hence, the results suggest that Cairene regular users of ridesourcing use public transport (PT) more frequently than Tehranian regular users.
3.3. Reasons for Not Using Public Transport
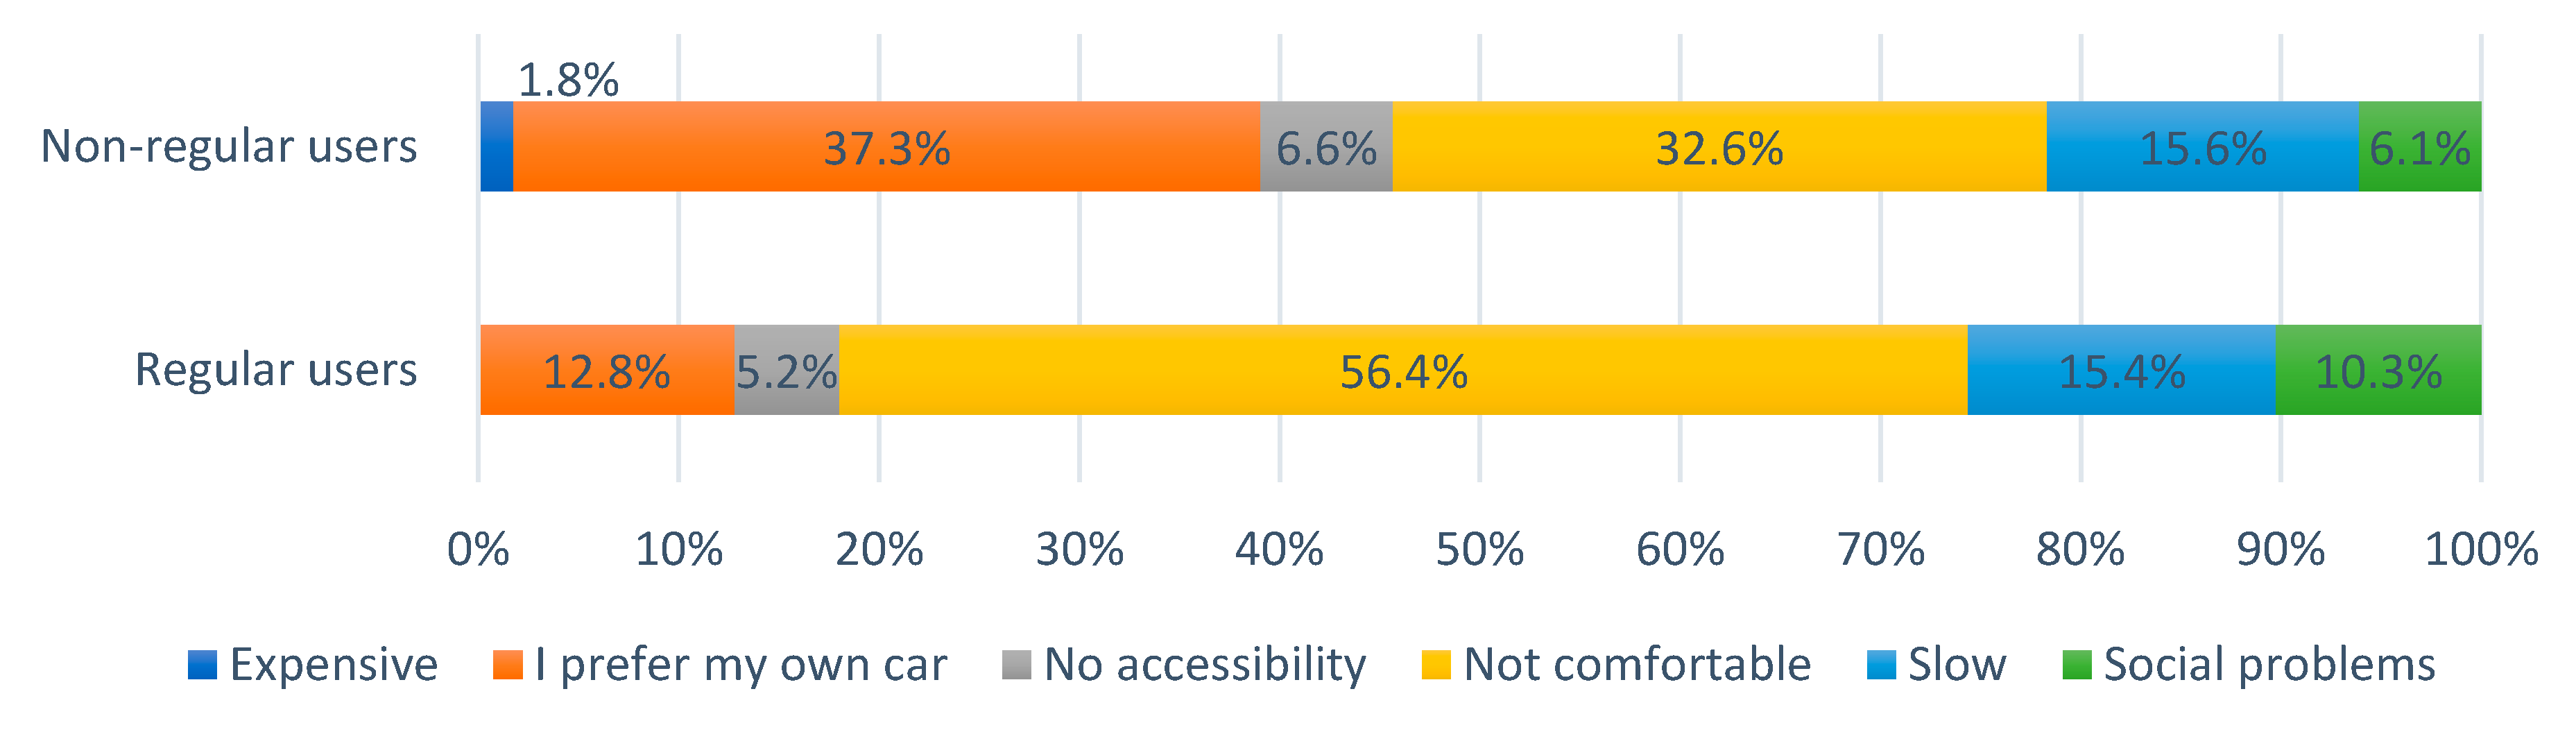
A multiple-choice question was asked to understand the reasons of regular ridesourcing users for not using public transport: “If you do not use public transit frequently, what is the reason?”. The answer to this question indicates the respondents’ attitudes and perceptions of public transport use. The choices of this multichoice question were designed based on the review of the studies in the field of mobility behaviors in the context of the MENA region [46,47,48,49,50]. The options include six reasons which are “I prefer my own car”, “It is expensive”, “It is not comfortable”, “No accessibility to public transportation”, “Social problems”, and “It is slow”. The respondents should choose only one option as the main reason for this question. We designed the options in the present form to gather subjective reasons associated with the way people decide not to use modes of public transport in their cities. The subjective factors are usually highly associated together and constitute a package of reasons for a decision. However, we asked them to select one reason because we tried to find the dominant subjective barrier in the mind of the respondent to using public transport, which may be useful for experts to understand which obstacles are more influential on the public perception. The reason “I prefer my own car” is related to lifestyle as Cullinane (2003) explained that the person is car-dependent and prefers using a car regardless of the quality of the public transport network. This reason might be correlated with the reason of “public transport is not comfortable”. However, if the comfort of public transport is improved, the person who mentioned “it is not comfortable” is more likely to use public transport than the person who mentioned, “I prefer my own car”, which is related to his or her lifestyle. The reason of social problems addresses social barriers for outside activities of women, fear of possible harassment, and inconvenience in public places. The answer “No accessibility/no public transportation” means that the public transport stations are not accessible or too far from the neighborhood or daily destinations of the respondent. The findings are shown in Figure 5 and Figure 6 for two groups of the binary variable “ridesourcing use” which are regular and non-regular users in Cairo and Tehran. The Chi-square test of independence indicates that in the Tehran sample, there is a significant association at 0.05 level (Pearson Chi-Square = 14.33 and p-value = 0.014) between the dummy variable “ridesourcing use” and the categorical variable “reasons for not using public transport” with the six mentioned categories. The findings in Tehran show that the major reasons of regular users of ridesourcing for not using PT are “not comfortable”, “slow transportation”, and “I prefer my own car”, which 56.4%, 15.4%, and 12.8% of regular users mentioned, respectively. The non-regular users reasoned, “I prefer my own car”, “not comfortable”, and “slow transportation” at proportions of 37.3%, 32.6%, and 15.6%, respectively. This finding shows that the subjective perceptions of comfortability and preference for using private cars instead of modes of public transport are the main reasons of regular and non-regular ridesourcing users for not using PT, but with significantly different percentages of the observations in the Tehran sample.
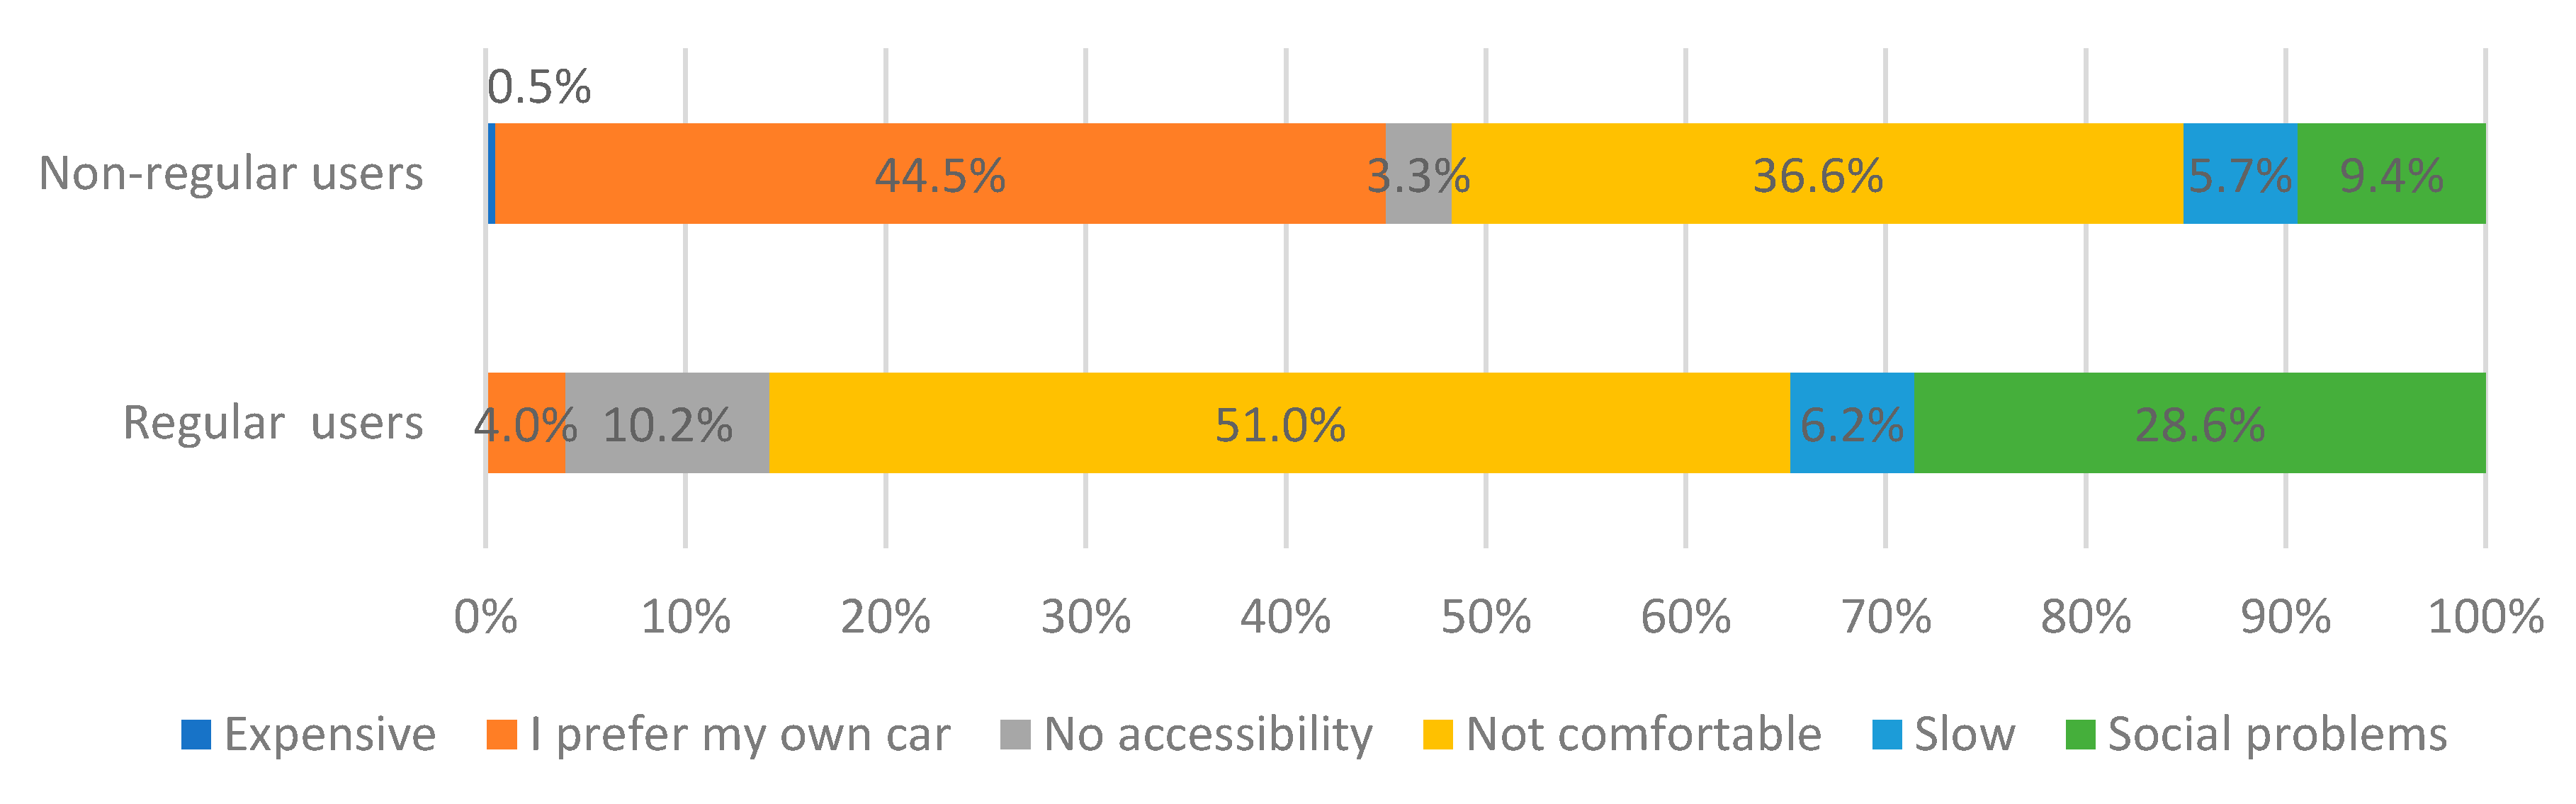
In the Cairo sample, the Chi-square test of independence shows that there is a significant correlation at a 0.001 level (Pearson Chi-Square = 49.26 and p-value < 0.001) between the binary variable of regular ridesourcing use and the categorical variable “reasons for not using public transport”. The main reasons of regular ridesourcing users for not using PT are “not comfortable” (51%), “social problems” (28.6%), and “no accessibility” (10.2%). The non-regular users reasoned “I prefer my own car”, “not comfortable”, and “social problems” with 44.5%, 36.6%, and 9.4%, respectively. Like the Tehran sample, the reason “not comfortable” is the most observed reason among regular users, while most non-regular users reasoned their preference for using a private car instead of public transport.
The comparison of Figure 5 and Figure 6 indicates that 12.8% of regular ridesourcing users in Tehran mentioned the reason “I prefer my own car” considerably more than Cairene regular users (4%), which is the lowest observed reasons among regular users in Cairo. In addition, the reason “social problems” is mentioned more among regular ridesourcing users in Cairo than Tehran. The regular users did not answer the reason “It is expensive” in either city.
3.4. The Binary Logit Models
We applied binary logistic regression to compare the odds of frequent use of public transport between regular ridesourcing users and the non-regular users for the sample of Tehran and Cairo. The non-regular user of ridesourcing is defined as the reference category for the variable of ridesourcing use in the logit model. The omnibus test indicates significantly different log-likelihoods at a 0.001 level between the model with explanatory variables and the baseline model for the samples of Cairo and Tehran with the Chi-square 173.662 and 375.694, respectively. The non-significant Chi-square in the Hosmer and Lemeshow test suggests that the model is a good fit to the data for Tehran with the p-value 0.105, and for Cairo with p-value 0.333. Table 3 shows the results of the omnibus test, the Hosmer and Lemeshow test, the Nagelkerke R squared, and the Cox and Snell R squared for the logit models of Cairo and Tehran.
The coefficients of estimators for the models of Tehran and Cairo are mentioned in Table 4 and Table 5. Examining the odds (probability of frequent PT use/probability of not frequent PT use) reveals the influence of each variable. Therefore, each estimator contributes to predicting the probability of frequent public transport use. Each exponentiated coefficient is the change in odds (odds ratio) by the multiplicative scale for a unit increase in the related estimator when other estimators are constant. An odds ratio bigger than 1 indicates that by holding other independent variables constant, the odds of frequent PT use increases by an increase of the independent variable, and vice versa decreases by a decrease of this independent variable. When the odds ratio is around 1, it means that a change of the independent variable does not change the odds of the dependent variable considerably. The odds ratio of less than 1 for one estimator means that by holding other estimators constant, the odds of the dependent variable decrease by an increase of this estimator.
The model for Tehran indicates five statistically significant estimators at the 0.001 level, which are gender, age, household car–driving license rate, work/study trip distance, and frequency of nonwork/study trips per week. Moreover, this model suggests that the variables of ridesourcing use and household income–cost rate are significant at a level of 0.01 (p-value = 0.003). The variable of ridesourcing use is categorical. Hence, its coefficient indicates the odds ratio of PT use for regular users relative to the non-regular rider sourcing users. Relative to the reference category (non-regular users), the odds of frequent PT use for the regular users are 58% (1–0.42) less than these odds for non-regular users. It means that by holding other independent variables constant, the odds of frequent PT use for the non-regular ridesourcing users are 2.38 times greater than regular users. Therefore, the results suggest that regular ridesourcing users are less likely to use public transport frequently than non-regular users of ridesourcing. The model reveals that women have 1.7 times greater odds of frequent PT use than males. Each unit increase of frequency of nonwork/study trips increases the odds of frequent public transport use by 14.4%. Therefore, the Tehranians who have a higher frequency of nonwork/study trips are more likely to use public transport frequently. On the other hand, each unit increase in age decreases the odds of frequent public transport use by 4%, which means younger people are more likely to use public transport regularly than older generations. Additionally, each unit increase of the household car–driver license ratio reduces the odds of regular PT use by 64.5%. Therefore, the households that have more available cars for their family members who possess a driver’s license are less likely to use public transport frequently.
Table 5 shows the binary logistic regression for Cairo, which includes three statistically significant estimators at the 0.001 level, which are age, gender, and household car–driving license rate. Additionally, three variables are significant at the 0.05 level: ridesourcing, income–cost ratio, and work/study trip distance. The frequency of nonwork/study trips per week is marginally significant, and its p-value is 0.054. The model reveals that the odds of frequent PT use for the regular ridesourcing users are 3.15 times greater than non-regular users. This means that regular ridesourcing users are significantly more likely to use public transport frequently than non-regular users. This result is in contrast with the Tehran model, where frequent users of ridesourcing are less likely to use public transport than non-regular users. Each unit increase of the household income–cost ratio and the household car–driving license decreases the odds of frequent PT use by 34.5% and 86%, respectively, while holding other variables constant. In other words, the Cairene households who have a higher income–cost ratio or more available cars for their driving license holders are less likely to use public transport regularly. The exponentiated coefficient of the variable age indicates that each unit increase in age reduces the odds of frequent PT use by 4.3%. Furthermore, each unit increase of frequency nonwork/study trips increases the odds of frequent PT use by around 10%. Like the Tehran model, women have 2.22 times greater odds of frequent PT use than men.
4. Discussion
The research in the field of urban mobility behavior often comes from high-income countries, while developing countries and emerging markets like those in the MENA region have a small share. The findings of such studies are context-specific, which are influenced by behaviors and preferences associated with the regional context. On the other hand, with a sharp growth rate of new ridesourcing services in the modal split of the large MENA cities, it is essential to study their effects on the mobility behavior of people in this region. Tehran and Cairo are two big MENA cities from the two most populous countries in this region. These two cities have some similarities in urban development, for example, both have more car-oriented than transit-oriented urban forms [42]. Moreover, the ridesourcing companies started providing services at the same time (after 2014) with a similar growth rate. Therefore, this paper studied the association between ridesourcing and the public transport mode choices to compare the different impacts of ridesourcing in these two cities as case studies in the MENA region. This study used two large samples in Tehran (2456 interviews) and Cairo (2255 interviews) to study the impact of regular ridesourcing use on the frequency of public transport use. The methodology of this study is different from the previous research in the West and the MENA context, which studied the modal shift from public transport to ridesourcing by some counterfactual questions [14,15,16,51,52,53]. They generally asked, “Which mobility mode would you have used if ridesourcing services had not been available?”. The respondents should think backward and imagine the manipulated past supposedly to respond to this question. However, in this study, we defined the group of regular ridesourcing users who adopted ridesourcing as their regular mode for their daily travel purposes. Then, we derived their current frequency use of public transport by the think-forward question in the present tense, “How often do you use public transit?”. Therefore, we studied the relationship between the regular use of ridesourcing with the current frequency use of public transport, instead of the modal shift in the past between these two mobility modes. In addition, we compared the socioeconomic characteristics as well as the preference for public transport use between regular and non-regular users of ridesourcing.
4.1. Socioeconomic Characteristics
The gender comparison between the regular users of ridesourcing shows that women are more regular users than men in Tehran (60.2%) and Cairo (63.6%). This finding is similar to other studies in the context of the global south, like in the MENA [54,55] and the African context [56]. One of the reasons is that women feel more secure in the ridesourcing travels than other modes, which is reported in other studies by Rizk et al. (2018) in Egypt [54] and Tirachini (2017) in Chile [17]. Additionally, the findings indicate that regular ridesourcing users have significantly more monthly household income than non-regular users in Cairo and Tehran. This finding is in the same direction as other similar studies in the Western context [4,16,51,52,57,58]. Concerning car ownership, the findings reveal that, in Cairo, the percentage of the regular ridesourcing users who do not have a household car is around 15%, which is remarkably greater than the percentage of regular users without a car in Tehran (around 2%).
Regarding the International Association of Public Transport (UITP) report in 2016, the number of cars per 1000 citizens in Tehran is 370 and in Cairo is 119 [59]. Therefore, the different percentage of non-car owners among regular users in this study is related to the big difference in the indicator of vehicles per capita between Tehran and Cairo. In addition, the Cairene regular users of ridesourcing who do not own a household car have a significantly higher income than non-regular users. Hence, ridesourcing is more likely to be regularly used instead of private cars by higher-income households in Cairo than Tehran. However, the impact of ridesourcing on car ownership needs to be studied in greater detail in terms of the socioeconomic parameters and social perception in further studies.
Our findings in the year of the survey show that Tehranians and Cairenes with lower household income and without a car were less likely to be regular users of ridesourcing. There are two possibilities that these economic classes will adopt ridesourcing as their main mobility mode. First, if the average fares of ridesourcing decrease through the competition among their companies, then the lower-income citizens are more likely to become regular users. Second, if the ridesourcing companies provide shared ridesourcing services like Lyft line and uberPool in these two cities, it would decrease the service fare and become more affordable for lower-income households. Brown (2017) showed that in Los Angeles, the ridesourcing services were used more in lower-income areas, with a higher percentage of families with no cars [60]. However, some social perceptions of shared ridesourcing should be considered, such as women may not prefer to share their ridesourcing with strangers in these two cities as it is reported in the other similar studies in Brazil and the American cities [17,61,62].
The age comparison in the Cairo sample indicates that the regular ridesourcing users are significantly younger (mean 28, median 25) than non-regular users. This finding is similar to other studies in the global north context regarding the age of ridesourcing adopters [5,52,63,64]. However, in Tehran, the age of regular users is not significantly different from the age of non-regular users.
4.2. Reason for Not Using Public Transport
The respondents were asked their main reason for not using public transport to understand the subjective barriers for using public transport among regular users of ridesourcing. The percentage of regular ridesourcing users in Tehran who prefer their private car instead of using public transport is around three times higher than Cairo. In contrast, regular users in Tehran mentioned the reason “lack of accessibility to public transport” less than in Cairo. This finding indicates that regular ridesourcing users in Tehran are more likely to be car-dependent than in Cairo, as Cullinane (2003), Sohn, and Yun (2009) explained: despite appropriate access to public transport, citizens prefer to use their private cars [26,65].
Moreover, the findings suggest that regular ridesourcing users have a significantly more subjective perception of discomfort in public transport than non-regular users in both cities. The discomfort in public transport is associated with high levels of crowding, psychological–social distances, and perceived risk and insecurity [66,67,68]. Furthermore, regular users in both cities reported social problems as the reason for not using public transport remarkably more than non-regular users. These two findings are related to another finding that women are more regular users of ridesourcing in both cities, and they feel less comfortable in public transport modes. So, they prefer to use uncrowded mobility modes in these two cities, which is reported in other studies [54,69].
4.3. Regular Use of Ridesourcing and Frequency of Public Transport Use
The findings suggest that regular ridesourcing users use public transport more frequently than non-regular users in Cairo and less frequently than non-regular users in Tehran. We used binary logistic regression to understand the relationship between regular use of ridesourcing and public transport by controlling the socioeconomic variables. The results indicate that the odds of frequent use of public transport for regular users are 3.15 times greater and 0.58 percent less than non-regular users in Cairo and Tehran, respectively. In other words, the probability of frequent use of public transport is positively correlated in Cairo and negatively correlated in Tehran with the regular use of ridesourcing. The findings in Cairo are in the same direction as the studies in Canada [70], Santiago de Chile [71], and Las Vegas [72] which supported the positive correlation between ridesourcing and public transport. However, the results of Tehran are similar to the studies in Denver [15], California [73], New Delhi [74], and in seven major American cities [16], which reported that ridesourcing users reduced their public transport use.
This contradictory correlation in Tehran and Cairo might be related to the differences in the accessibility of public transport, socioeconomic parameters, and social preference. Regarding the report of UITP in 2016, Cairo, with a population of around 19 million people, has 113 buses and 4 km of urban rail transit per one million population [59]. This report mentioned that Tehran has around 9 million population with 569 buses and 20 km of urban rail transit per one million population. According to these indicators, Tehran has a better public transport system than Cairo. Therefore, the findings suggest that although the public transport system in Tehran is better than Cairo, the regular ridesourcing users in Tehran are less likely to use public transport than in Cairo. This result in Tehran is in the same direction as the study of Cullinane (2003) in Hong Kong, which indicated a high car dependency of the citizens, even though they have appropriate access to the public transport system [26]. This result is also supported by the finding of another part of this study about the perception of public transport. The finding suggests that Tehranian regular users of ridesourcing prefer to use their private cars instead of public transport significantly more than Cairene regular users.
Moreover, the average age of regular users in Cairo is significantly below regular users in Tehran, and it is suggested in many studies that younger people tend to be more multimodal travelers [75]. By considering these reasons, the results suggest that regular ridesourcing users in Tehran are more car-dependent, and they are less likely to use public transport than non-regular users. However, regular ridesourcing users in Cairo are more multimodal travelers, and they are more likely to use public transport than non-regular users.
4.4. Limitations and Further Research
The percentages of the regular ridesourcing users in both cities were lower in comparison to the percentages of non-regular users in our study. The interviews were conducted randomly among citizens of 12 neighborhoods in Tehran and Cairo, and we asked their main mobility modes for their daily travels. Then, based on their answers, we identified the regular users of ridesourcing in both cities. The percentage of respondents who used ridesourcing regularly was lower than the percentage of non-regular users who used the other dominant mobility modes in 2017. Therefore, for further research, we propose to make a larger sample size of the regular ridesourcing users to study the impact of ridesourcing on their mobility behavior. Moreover, we did not have access to precise data about the accessibility of each respondent to public transport like bus, microbus, and transit stations. Therefore, to have a representative sample of the city to cover three levels of public transport accessibility (high, medium, low), we used the assumption of the association between the public transport accessibility and period of neighborhood development. Therefore, we suggest further research to gather more precise data of the public transport accessibility at individual and neighborhood levels in Tehran and Cairo to study the impact of this indicator on the public transport mode choice behaviors among ridesourcing users. As the correlation between regular use of ridesourcing and public transport could affect the VKTs in these two cities, further research is suggested in the field of ridesourcing impacts on the VKTs. In this study, the group of non-regular users includes the regular users of other modes, so that they could be categorized based on their mobility behaviors into different groups. Therefore, more research is proposed to compare and study the mode choice of public transport between regular users of ridesourcing and other transport modes separately.
5. Conclusions
With the increasing share of ridesourcing services in the modal share of the large MENA cities, it is necessary to study the impacts of this new emerging transport mode on the mobility behaviors and mode choices of the citizens. However, there is little research on whether ridesourcing has positive or negative impacts on the sustainability of urban transport in the MENA region. The evaluation of ridesourcing as a sustainable or unsustainable transport mode depends on whether it supports or replaces other sustainable modes like public transport and nonmotorized modes [17,76]. This paper tried to give an insight into the relationship between ridesourcing adaptation and the frequency of public transport use in two cities of the MENA region. The principle of this study is based on the assumption that regular use of one transport mode affects other mode choices.
The findings suggest that the association between the regular use of ridesourcing and public transport use depends on the context, the objective parameters, and the social perception of the urban transport system in the cities. This study indicates that the regular use of ridesourcing in the two big cities of the MENA region has a contradictory correlation with public transport use. It shows that in Cairo, the regular use of ridesourcing has a positive correlation with the probability of frequent public transport use. In contrast, this correlation is negative in Tehran, where the regular ridesourcing users are more car-dependent than Cairenes. The results indicated that although Tehran has a better public transport system than Cairo, regular users of ridesourcing in Tehran are significantly less likely to use public transport than in Cairo. Moreover, we mentioned that the association in each of these two cities is similar to particular cities in the global north. This different correlation was studied in terms of socioeconomic factors, travel parameters, and the citizens’ perception of the public transport system in these two cities. In both cities, regular users have significantly more monthly house income than non-regular users, and women regularly use ridesourcing more than men. Moreover, the study shows that in both cities, the regular ridesourcing users have substantially more perception of discomfort in public transport than non-regular users. Therefore, comfort in public transport should be improved to attract this type of commuters. Moreover, it is recommended that the transport policymakers encourage the ridesourcing companies to integrate their services with the public transport system to provide first/last mile services. Additionally, these companies could offer some discounts for passengers who use ridesourcing in connection with public transport as a complementary mode. These policies have been implemented in some global north cities [17,77]. In addition, the policy of adding a special charge on ridesourcing fares could be useful to encourage regular ridesourcing users to use more public transport.
Author Contributions
Conceptualization, H.M. (Hamid Mostofi); Methodology, H.M. (Hamid Mostofi); Resources and data, H.M. (Houshmand Masoumi); Formal analysis, H.M. (Hamid Mostofi); Writing—original draft preparation, H.M. (Hamid Mostofi); Writing—review and editing, H.M. (Hamid Mostofi), H.M. (Houshmand Masoumi), and H.-L.D. All authors have read and agreed to the published version of the manuscript.
Funding
This study was undertaken by the support of the German Research Foundation (DGF) as the research project Urban Travel Behavior in Large Cities of MENA Region (UTB-MENA) with the project number MA6412/3-1.
Acknowledgments
We acknowledge support by the German Research Foundation and the Open Access Publication Fund of Technische Universität Berlin.
Conflicts of Interest
The authors declare no conflict of interest. The funders had no role in the design of the study; in the collection, analyses, or interpretation of data; in the writing of the manuscript; or in the decision to publish the results.
References
- Gössling, S. ICT and transport behavior: A conceptual review. Int. J. Sustain. Transp. 2018. [Google Scholar] [CrossRef]
- Line, T.; Jain, J.; Lyons, G. The role of ICTs in everyday mobile lives. J. Transp. Geogr. 2011, 19, 1490–1499. [Google Scholar] [CrossRef]
- Shaheen, S.; Adam, C.; Ismail, Z.; Beaudry, K. Smartphone Applications to Influence Travel Choices: Practices and Policies, Report No. FHWA-HOP-16-023. 2016. Available online: https://ops.fhwa.dot.gov/publications/fhwahop16023/fhwahop16023.pdf (accessed on 26 May 2020).
- Transportation Research Board. Between Public and Private Mobility: Examining the Rise of Technology-Enabled Transportation Services; Special Report 319; Transportation Research Board: Washington, DC, USA, 2016. [Google Scholar]
- Rayle, L.; Shaheen, S.; Chan, N.; Dai, D.; Cervero, R. App-Based, On-Demand Ride Services: Comparing Taxi and Ridesourcing Trips and User Characteristics in San Francisco; UCTC-FR-2014 08; University of California Transportation Center: Berkeley, CA, USA, 2014. [Google Scholar]
- Chan, N.D.; Shaheen, S.A. Ridesharing in North America: Past, Present, and Future. Transp. Rev. 2012, 32, 93. [Google Scholar] [CrossRef]
- Firnkorn, J.; Müller, M. What Will Be the Environmental Effects of New Free-Floating Car-Sharing Systems? The Case of car2go in Ulm. Ecol. Econ. 2011, 70, 1519. [Google Scholar] [CrossRef]
- Martin, E.; Shaheen, S.A. Greenhouse Gas Emission Impacts of Carsharing in North America. IEEE Trans. Intell. Transp. Syst. 2011, 12, 1074–1086. [Google Scholar] [CrossRef] [Green Version]
- Martin, E.; Shaheen, S.A.; Lidicker, J. Impact of Carsharing on Household Vehicle Holdings. Transp. Res. Rec. J. Transp. Res. Board 2010, 2143, 150. [Google Scholar] [CrossRef]
- American Public Transportation Association, Transit Ridership APTA Report, Third Quarter. 2017. Available online: http://www.apta.com/resources/statistics/Documents/Ridership/2017-q3-ridership-APTA.pdf (accessed on 30 May 2020).
- Jin, S.T.; Kong, H.; Wu, R.; Sui, D.Z. Ridesourcing, the sharing economy, and the future of cities. Cities 2018, 76, 96–104. [Google Scholar] [CrossRef]
- Light, S. Precautionary federalism and the sharing economy. Emory Law J. 2017, 66, 333–394. [Google Scholar]
- Sorrell, S. Jevons’ Paradox revisited: The evidence for backfire from improved energy efficiency. Energy Policy 2009, 37, 1456–1469. [Google Scholar] [CrossRef]
- Rayle, L.; Dai, D.; Chan, N.; Cervero, R.; Shaheen, S. Just a better taxi? A survey-based comparison of taxis, transit, and ridesourcing services in San Francisco. Transp. Policy 2016, 45, 168–178. [Google Scholar] [CrossRef] [Green Version]
- Henao, A. Impacts of Ride Sourcing-Lyft and Uber-on Transportation Including VMT, Mode Replacement, Parking, and Travel Behavior. Ph.D Thesis, Department of Civil and Environmental Engineering, University of Colorado, Denver, CO, USA, 2017. [Google Scholar]
- Clewlow, R.; Mishra, G. Disruptive Transportation: The Adoption, Utilization, and Impacts of Ride-Hailing in the United States; Research Report UCD-ITS-RR-17-07; Institute of Transportation Studies, University of California: Davis, CA, USA, 2017; Available online: https://itspubs.ucdavis.edu/wp-content/themes/ucdavis/pubs/download_pdf.php?id=2752 (accessed on 2 July 2020).
- Tirachini, A. Ride-hailing, travel behaviour and sustainable mobility: An international review. Transportation 2019. [Google Scholar] [CrossRef]
- American Public Transportation Association. Shared Mobility and the Transformation of Public Transit, Report TCRP-J-11/TASK21. 2016. Available online: https://www.apta.com/wp-content/uploads/Resources/resources/reportsandpublications/Documents/APTA-Shared-Mobility.pdf (accessed on 1 July 2020).
- Ewing, R.; Cervero, R. Travel and the built environment: A meta analysis. J. Am. Plan. Assoc. 2010, 76, 265–294. [Google Scholar] [CrossRef]
- Kuhnimhof, T.; Armoogum, J.; Buehler, R.; Dargay, J.; Denstadli, J.; Yamamoto, T. Men shape a downward trend in car use among young adults—Evidence from six industrialized countries. Transp. Rev. 2012, 32, 761–779. [Google Scholar] [CrossRef]
- Newman, P.; Kenworthy, J. The End of Automobile Dependence: How Cities Are Moving beyond Car-Based Planning; Island Press: Washington, DC, USA, 2015; ISBN 9781610914628. [Google Scholar]
- Mattioli, G.; Anable, J.; Vrotsou, K. Car dependent practices. Findings from a sequence pattern mining study of UK time use data. Transp. Res. Part A Policy Pract. 2016, 89, 56–72. [Google Scholar] [CrossRef] [Green Version]
- Dimitriou, H.T. Cities and automobile dependence: An international sourcebook. Util. Policy 1991, 1, 352–354. [Google Scholar] [CrossRef]
- Gray, D.; Farrington, J.; Shaw, J.; Martin, S.; Roberts, D. Car dependence in rural Scotland. Transport policy, devolution and the impact of the fuel duty escalator. J. Rural Stud. 2001, 17, 113–125. [Google Scholar] [CrossRef]
- Verma, M. Growing car ownership and dependence in India and its policy implications. Case Stud. Transp. Policy 2015, 3. [Google Scholar] [CrossRef]
- Cullinane, S.; Cullinane, K. Car dependence in a public transport dominated city: Evidence from Hong Kong. Transp. Res. Part D Transp. Environ. 2003, 8, 129–138. [Google Scholar] [CrossRef]
- Tertoolen, G.; Van Kreveld, D.; Verstraten, B. Psychological resistance against attempts to reduce private car use. Transp. Res. Part A 1998, 32, 187–200. [Google Scholar] [CrossRef]
- Ellaway, A.; Macintyre, S.; Hiscock, R.; Kearns, A. In driving seat: Psychosocial benefits from private motor vehicle transport compared to public transport. Transp. Res. Part F 2003, 6, 217–231. [Google Scholar] [CrossRef]
- Gardner, B.; Abraham, C. What drives car use: A ground theory analysis of commuter’s reason’s for driving. Transp. Res. Part F 2007, 10, 187–200. [Google Scholar] [CrossRef]
- Hamdi, N.; Mourad, M.; Knecht, E.; Potter, M. Egypt Passes Law Regulating Uber, Careem Ride-Sharing Services. Available online: https://www.reuters.com/article/us-egypt-uber/egypt-passes-law-regulating-uber-careem-ride-sharing-services-idUSKBN1I81VG (accessed on 7 May 2018).
- Alkhalisi, Z.; Daftari, A. The Ride-Hailing App that Rules Tehran’s Busy Streets. Available online: https://money.cnn.com/2017/07/30/technology/iran-snapp-ride-hailing/ (accessed on 24 May 2020).
- The Guardian. Snapp: How Tehran’s Answer to Uber is Changing How People Travel, and Live. Available online: https://www.theguardian.com/cities/2017/jul/31/snapp-how-tehran-answer-to-uber-is-changing-how-people-travel-and-live (accessed on 24 May 2020).
- Bamberg, S.; Ajzen, I.; Schmidt, P. Choice of travel mode in the theory of planned behavior: The roles of past behavior, habit, and reasoned action. Basic Appl. Soc. Psychol. 2003, 25, 175–187. [Google Scholar] [CrossRef]
- Wang, J. Appraisal of Factors Influencing Public Transport Patronage; Research Report 434; NZ Transport Agency: Wellington, New Zealand, 2011. [Google Scholar]
- Greer, M.R.; van Campen, B. Influences on public transport utilization: The case of Auckland. J. Public Transp. 2011, 14, 51–68. [Google Scholar] [CrossRef] [Green Version]
- Litman, T. Land Use Impacts on Transport: How Land Use Factors Affect Travel Behavior; Technical Report; Victoria Transport Policy Institute: Victoria, BC, Canada, 2007; Available online: https://www.vtpi.org/landtravel.pdf (accessed on 1 July 2020).
- Putman, S.H. Integrated Urban Models Volume 1: Policy Analysis of Transportation and Land Use (RLE: The City); Routledge: London, UK, 2013; Volume 1. [Google Scholar] [CrossRef]
- Beimborn, E.; Horowitz, A.; Vijayan, S.; Bordewin, M. An Overview: Land Use and Economic Development in Statewide Transportation Planning; Technical Report; U.S. Department of Transportation, Federal Highway Administration: Washington, DC, USA, 1999. [Google Scholar]
- Engelen, G. The theory of self-organization and modelling complex urban systems. Eur. J. Oper. Res. 1988, 37, 42–57. [Google Scholar] [CrossRef]
- Chen, C.; Varley, D.; Chen, J. What affects transit ridership? A dynamic analysis involving multiple factors, lags and asymmetric behavior. Urban Stud. 2011, 48, 1893–1908. [Google Scholar] [CrossRef]
- Litman, T. Valuing transit service quality improvements. J. Public Transp. 2008, 11, 43–63. [Google Scholar] [CrossRef] [Green Version]
- Masoumi, H.; Gouda, A.A.; Layritz, L.; Stendera, P.; Matta, C.; Tabbakh, H.; Fruth, E. Urban Travel Behavior in Large Cities of MENA Region: Survey Results of Cairo, Istanbul, and Tehran; Discussion Paper Series No. 41/2018; Center for Technology and Society: Santa Barbara, CA, USA, 2018. [Google Scholar]
- Pallant, J. SPSS Survival Manual: A Step by Step Guide to Data Analysis Using SPSS, 4th ed.; Allen & Unwin Book Publishers: Sydney, Australia, 2010. [Google Scholar]
- Hair, J.F.; Black, W.C.; Babin, B.J.; Anderson, R.E.; Tatham, R.L. Multivariate Data Analysis, 7th ed.; Pearson: New York, NY, USA, 2010. [Google Scholar]
- Hosmer, D.W.; Lemesbow, S. Goodness of fit tests for the multiple logistic regression model. Commun. Stat. Theory Methods 1980, 9, 1043–1069. [Google Scholar] [CrossRef]
- Etminani-Ghasrodashti, R.; Ardeshiri, M. Modeling travel behavior by the structural relationships between lifestyle, built environment and non-working trips. Transp. Res. Policy Pract. 2015, 78, 506–518. [Google Scholar] [CrossRef]
- Etminani-Ghasrodashti, R.; Ardeshiri, M. The impacts of built environment on home-based work and nonwork trips: An empirical study from Iran. Transp. Res. Policy Pract. 2016, 85, 196–207. [Google Scholar] [CrossRef]
- Soltani, A.; Esmaeili-Ivaki, Y. The Influence of Urban Physical Form on Trip Generation, Evidence from Metropolitan Shiraz, Iran. Indian J. Sci. Technol. 2011, 4, 1168–1174. [Google Scholar] [CrossRef]
- Al-Atawi, A.; Saleh, W. Travel behavior in Saudi Arabia and the role of social factors. Transport 2014, 29, 269–277. [Google Scholar] [CrossRef] [Green Version]
- Danaf, M.; Abou-Zeid, M.; Kaysi, I. Modeling travel choices of students at a private, urban university: Insights and policy implications. Case Stud. Transp. Policy 2014, 2, 142–152. [Google Scholar] [CrossRef]
- Feigon, S.; Colin, M. Shared Mobility and the Transformation of Public Transit; TCRP Research Report; Transportation Research Board: Washington, DC, USA, 2016; Volume 188. [Google Scholar] [CrossRef]
- Alemi, F.; Circella, G.; Handy, S.; Mokhtarian, P. What influences travelers to use Uber? Exploring the factors affecting the adoption of on-demand ride services in California. Travel Behav. Soc. 2018, 13, 88–104. [Google Scholar] [CrossRef]
- Hampshire, R.; Simek, C.; Fabusuyi, T.; Di, X.; Chen, X. Measuring the Impact of an Unanticipated Suspension of Ride-Sourcing Ridesourcing in Austin, Texas. SSRN Electr. J. 2017. [Google Scholar] [CrossRef]
- Rizk, N.; Salem, N.; Weheba, N. A Gendered Analysis of Ridesharing: Perspectives from Cairo, CIPPEC publications, Egypt. 2018. Available online: http://www.cippec.org/wp-content/uploads/2018/09/UrbanTransport-completo-web_CIPPEC.pdf (accessed on 2 July 2020).
- IFC. Accenture, Uber. Driving Toward Equality: Women, Ride-Hailing and the Sharing Economy (Rep.). 2018. Available online: https://www.ifc.org/wps/wcm/connect/topics_ext_content/ifc_external_corporate_site/gender+at+ifc/drivingtowardequality (accessed on 2 July 2020).
- Dzisi, E.; Ackaah, W.; Aprimah, B.; Adjei, E. Understanding demographics of ride-sourcing ridesourcing and the factors that underlie its use among young people. Sci. Afr. 2020, 7. [Google Scholar] [CrossRef]
- Circella, G.; Alemi, F. Transport Policy in the Era of Ride hailing and Other Disruptive Transportation Technologies. Adv. Transp. Policy Plan. 2018, 1, 119–144. Available online: http://transp-or.epfl.ch/heart/2018/abstracts/5400.pdf (accessed on 2 July 2020).
- Feigon, S.; Colin, M. Broadening Understanding of the Interplay between Public Transit, Shared Mobility, and Personal Automobiles; Pre-Publication Draft of TCRP Research Report 195; Transportation Research Board: Washington, DC, USA, 2018. [Google Scholar]
- International Association of Public Transport (UITP). MENA Transport Report. 2016. Available online: https://mena.uitp.org/sites/default/files/MENA%20CTE_MENA%20Transport%20Report%202016.pdf (accessed on 2 July 2020).
- Brown, A.E. Car-less or car-free? Socioeconomic and mobility differences among zero-car households. Transp. Policy 2017, 60, 152–159. [Google Scholar] [CrossRef]
- De Souza Silva, L.A.; de Andrade, M.O.; Alves Maia, M.L. How does the ride-hailing systems demand affect individual transport regulation? Res. Transp. Econ. 2018, 69, 600–606. [Google Scholar] [CrossRef] [Green Version]
- Sarriera, J.M.; Álvarez, G.E.; Blynn, K.; Alesbury, A.; Scully, T.; Zhao, J. To Share or Not to Share: Investigating the Social Aspects of Dynamic Ridesharing. Transp. Res. Record 2017, 2605, 109–117. [Google Scholar] [CrossRef] [Green Version]
- Circella, G.; Tiedeman, K.; Handy, S.; Alemi, F.; Mokhtarian, P. What Affects Millennials’ Mobility? Part I: Investigating the Environmental Concerns, Lifestyles, Mobility-Related Attitudes and Adoption of Technology of Young Adults in California, UC Davis: National Center for Sustainable Transportation. 2016. Available online: https://escholarship.org/uc/item/6wm51523 (accessed on 24 May 2020).
- Conway, M.W.; Salon, D.; King, D.A. Trends in Taxi Use and the Advent of Ridehailing, 1995–2017: Evidence from the US National Household Travel Survey. Urban Sci. 2018, 2, 79. [Google Scholar] [CrossRef] [Green Version]
- Sohn, K.; Yun, J. Separation of car-dependent commuters from normal-choice riders in mode-choice analysis. Transportation 2009, 36, 423–436. [Google Scholar] [CrossRef]
- Cox, T.; Houdmont, J.; Griffiths, A. Rail passenger crowding, stress, health and safety in Britain. Transp. Res. Part A Policy Pract. 2006, 40, 244–258. [Google Scholar] [CrossRef] [Green Version]
- Cheng, Y.-H. Exploring passenger anxiety associated with train travel. Transportation 2010, 37, 875–896. [Google Scholar] [CrossRef]
- Mahudin, D.; Cox, T.; Griffiths, A. Measuring rail passenger crowding: Scale development and psychometric properties. Transp. Res. Part F Traffic Psychol. Behav. 2012, 15, 1. [Google Scholar] [CrossRef]
- Shahangian, R.; Kermanshah, M.; Mokhtarian, P.L. Gender differences in response to policies targeting commute to automobile-restricted central business district. J. Transp Res. Board 2012, 2320, 80–89. [Google Scholar] [CrossRef]
- Young, M.; Farber, S. The who, why, and when of Uber and other ride-hailing trips: An examination of a large sample household travel survey. Transp. Res. Part A Policy Pract. 2019, 119, 383–392. [Google Scholar] [CrossRef] [Green Version]
- Tirachini, A.; del Río, M. Ride-hailing in Santiago de Chile: Users’ characterisation and effects on travel behaviour. Transp. Policy 2019, 82, 46–57. [Google Scholar] [CrossRef]
- Contreras, S.D.; Paz, A. The effects of ride-hailing companies on the taxicab industry in Las Vegas, Nevada. Transp. Res. Part A Policy Pract. 2018, 115, 63–70. [Google Scholar] [CrossRef]
- Alemi, F. What Makes Travelers Use Ridehailing? Exploring the Latent Constructs behind the Adoption and Frequency of Use of Ridehailing Services, and Their Impacts on the Use of Other Travel Modes; Research Report UCD-ITS-RR-18-16; Institute of Transportation Studies, University of California: Davis, CA, USA, 2018; Available online: https://its.ucdavis.edu/research/publications/?frame=https%3A%2F%2Fitspubs.ucdavis.edu%2Findex.php%2Fresearch%2Fpublications%2Fpublication-detail%2F%3Fpub_id%3D2965 (accessed on 2 July 2020).
- Agarwal, S.; Mani, D.; Telang, R. The Impact of Ridesharing Services on Congestion: Evidence from Indian Cities. SSRN Electr. J. 2019. [Google Scholar] [CrossRef]
- Sakaria, N.; Stehfest, N. Millennials and Mobility: Understanding the Millennial Mindset and New Opportunities for Transit Providers; Transportation Research Board Report; National Academies of Sciences, Engineering, and Medicine: Washington, DC, USA, 2013. [Google Scholar] [CrossRef]
- Mostofi, H.; Masoumi, H.; Dienel, H.-L. The Association between Regular Use of Ridesourcing and Walking Mode Choice in Cairo and Tehran. Sustainability 2020, 12, 5623. [Google Scholar] [CrossRef]
- Meyer, G.; Shaheen, S. Disrupting Mobility; Springer: Berlin, Germany, 2017. [Google Scholar] [CrossRef]
Figure 1.
The location of the six selected neighborhoods in Tehran [42].
Figure 1.
The location of the six selected neighborhoods in Tehran [42].

Figure 2.
The location of the six selected neighborhoods in Cairo [42].
Figure 2.
The location of the six selected neighborhoods in Cairo [42].

Figure 3.
Frequency of use of public transport (PT) among regular and non-regular users of ridesourcing in Tehran.
Figure 3.
Frequency of use of public transport (PT) among regular and non-regular users of ridesourcing in Tehran.

Figure 4.
Frequency of use of public transport among regular and non-regular users of ridesourcing in Cairo.
Figure 4.
Frequency of use of public transport among regular and non-regular users of ridesourcing in Cairo.

Figure 5.
Reasons of regular and non-regular ridesourcing users for not regularly using PT in Tehran.
Figure 5.
Reasons of regular and non-regular ridesourcing users for not regularly using PT in Tehran.

Figure 6.
Reasons of regular and non-regular ridesourcing users for not regularly using PT in Cairo.
Figure 6.
Reasons of regular and non-regular ridesourcing users for not regularly using PT in Cairo.


Table 1.
Demographic profile of the respondents in Cairo.
| Cairo Total Sample N = 2255 | Regular Users N = 151 | Non-Regular Users N = 2104 | p-Value | ||||
|---|---|---|---|---|---|---|---|
| Count | % | Count | % | ||||
| Age Group | <19 | 15 | 9.9% | 109 | 5.2% | <0.001 *** | |
| 19 ≤ Age < 25 | 52 | 34.4% | 427 | 20.3% | |||
| 25 ≤ Age < 35 | 60 | 39.7% | 611 | 29.0% | |||
| 35 ≤ Age < 45 | 15 | 9.9% | 403 | 19.2% | |||
| 45 ≤ Age < 55 | 3 | 2.0% | 276 | 13.1% | |||
| 55 ≤ Age < 65 | 5 | 3.3% | 226 | 10.7% | |||
| 65≤ | 1 | 0.7% | 52 | 2.5% | |||
| Gender | Female | 96 | 63.6% | 809 | 38.5% | <0.001 *** | |
| Male | 55 | 36.4% | 1295 | 61.5% | |||
| Activity | No Work/Study | 38 | 25.2% | 523 | 24.9% | 0.930 | |
| Work/Study | 113 | 74.8% | 1581 | 75.1% | |||
| Having a Household Car | No | 23 | 15.2% | 692 | 32.9% | <0.001 *** | |
| Yes | 128 | 84.8% | 1412 | 67.1% | |||
| Mean | Median | Mean | Median | p-value MWUT | p-value MT | ||
| Age | 27.87 | 25.00 | 35.55 | 32.00 | <0.001 *** | <0.001 *** | |
| Household Income | 11,542.22 | 9000.00 | 6940.44 | 6000.00 | <0.001 *** | <0.001 *** | |
| Living Cost | 9393.06 | 8000.00 | 6180.74 | 5000.00 | <0.001 *** | <0.001 *** | |
| Income–Cost Ratio | 1.29 | 1.11 | 1.18 | 1.00 | <0.001 *** | <0.001 *** | |
* p < 0.05; ** p < 0.01; *** p < 0.001; MWUT is Mann Whitney U test, and MT is median test.
Table 2.
Demographic profile of the respondents in Tehran.
| Tehran Total Sample N = 2456 | Regular Users N = 88 | Non-Regular Users N = 2368 | p-Value | ||||
|---|---|---|---|---|---|---|---|
| Count | % | Count | % | ||||
| Age Group | <19 | 1 | 1.1% | 87 | 3.7% | 0.261 | |
| 19 ≤ Age < 25 | 7 | 8.0% | 279 | 11.8% | |||
| 25 ≤ Age < 35 | 29 | 33.0% | 655 | 27.7% | |||
| 35 ≤ Age < 45 | 25 | 28.4% | 600 | 25.3% | |||
| 45 ≤ Age < 55 | 18 | 20.5% | 433 | 18.3% | |||
| 55 ≤ Age < 65 | 3 | 3.4% | 218 | 9.2% | |||
| 65≤ | 5 | 5.7% | 96 | 4.1% | |||
| Gender | Female | 53 | 60.2% | 1157 | 48.9% | 0.036 * | |
| Male | 35 | 39.8% | 1211 | 51.1% | |||
| Activity | No Work/Study | 31 | 35.2% | 746 | 31.5% | 0.461 | |
| Work/Study | 57 | 64.8% | 1622 | 68.5% | |||
| Having a Household Car | No | 2 | 2.3% | 251 | 10.6% | 0.002 ** | |
| Yes | 86 | 97.7% | 2117 | 89.4% | |||
| Median | Median | Mean | Median | p-value MWUT | p-value MT | ||
| Age | 38.37 | 35.00 | 38.31 | 37.00 | 0.920 | 0.926 | |
| Household Income | 1813.02 | 1403.00 | 1327.24 | 1169.00 | <0.001 *** | <0.001 *** | |
| Living Cost | 1374.69 | 1169.00 | 1065.81 | 935.00 | <0.001 *** | <0.001 *** | |
| Income–Cost Ratio | 1.32 | 1.17 | 1.29 | 1.14 | 0.064 | 0.291 | |
* p < 0.05; ** p < 0.01; *** p < 0.001; MWUT is Mann Whitney U test, and MT is median test.
Table 3.
The results of the Hosmer and Lemeshow test and the omnibus test.
| Tests | Cairo | Tehran |
|---|---|---|
| Omnibus Tests of Model Coefficients | ||
| Chi-square | 173.662 | 375.694 |
| p-value | <0.001 | <0.001 |
| −2 Log-likelihood | 920.844 | 1958.855 |
| Cox and Snell R Square | 0.180 | 0.200 |
| Nagelkerke R Square | 0.251 | 0.266 |
| Hosmer and Lemeshow Test | ||
| Chi-square | 9.114 | 13.201 |
| p-value | 0.333 | 0.105 |
| Overall Percentage of Correct Prediction | 71.9% | 70.2% |
Table 4.
Binary logistic regression for the Tehran sample.
| Independent Variable: Frequent PT Use | B | S.E. | Wald | Sig. | Exp(B) | |
|---|---|---|---|---|---|---|
| Ridesourcing Use | Regular Users = 1, Non-Regular = 0 | −0.863 | 0.290 | 8.854 | 0.003 | 0.422 |
| Gender | Female = 1 Male = 0 | 0.521 | 0.114 | 20.967 | <0.001 | 1.684 |
| Age | −0.040 | 0.005 | 69.892 | <0.001 | 0.960 | |
| Income–Cost Rate | −0.476 | 0.171 | 7.710 | 0.005 | 0.621 | |
| Household Car–Driving License Rate | −1.036 | 0.200 | 26.730 | <0.001 | 0.355 | |
| Work/Study Trip Distance | Meter | 0.000 | 0.000 | 105.592 | <0.001 | 1.000 |
| Frequency Nonwork/Study Trips | Per Week | 0.134 | 0.020 | 43.212 | <0.001 | 1.144 |
| Constant | 1.301 | 0.330 | 15.562 | <0.001 | 3.675 | |
Table 5.
Binary logistic regression for the Cairo sample.
| Independent Variable: Frequent PT Use | B | S.E. | Wald | p-Value | Exp(B) | |
|---|---|---|---|---|---|---|
| Ridesourcing Use | Regular Users = 1 Non-Regular = 0 | 1.148 | 0.494 | 5.408 | 0.020 | 3.153 |
| Gender | Female = 1, Male = 0 | 0.799 | 0.200 | 16.006 | <0.001 | 2.223 |
| Age | −0.044 | 0.008 | 34.777 | <0.001 | 0.957 | |
| Income–Cost Rate | −0.423 | 0.193 | 4.826 | 0.028 | 0.655 | |
| Household Car–Driving License Rate | −1.950 | 0.246 | 62.848 | <0.001 | 0.142 | |
| Work/Study Trip Distance | Meter | 0.000 | 0.000 | 5.070 | 0.024 | 1.000 |
| Frequency Nonwork/Study Trips | Per Week | 0.092 | 0.048 | 3.715 | 0.050 | 1.097 |
| Constant | 3.831 | 0.428 | 80.064 | <0.001 | 46.086 | |
© 2020 by the authors. Licensee MDPI, Basel, Switzerland. This article is an open access article distributed under the terms and conditions of the Creative Commons Attribution (CC BY) license (http://creativecommons.org/licenses/by/4.0/).
Share and Cite
MDPI and ACS Style
Mostofi, H.; Masoumi, H.; Dienel, H.-L. The Relationship between Regular Use of Ridesourcing and Frequency of Public Transport Use in the MENA Region (Tehran and Cairo). Sustainability 2020, 12, 8134. https://doi.org/10.3390/su12198134
AMA Style
Mostofi H, Masoumi H, Dienel H-L. The Relationship between Regular Use of Ridesourcing and Frequency of Public Transport Use in the MENA Region (Tehran and Cairo). Sustainability. 2020; 12(19):8134. https://doi.org/10.3390/su12198134
Chicago/Turabian StyleMostofi, Hamid, Houshmand Masoumi, and Hans-Liudger Dienel. 2020. "The Relationship between Regular Use of Ridesourcing and Frequency of Public Transport Use in the MENA Region (Tehran and Cairo)" Sustainability 12, no. 19: 8134. https://doi.org/10.3390/su12198134
Note that from the first issue of 2016, this journal uses article numbers instead of page numbers. See further details here.