Urban Sprawl, Socioeconomic Features, and Travel Patterns in Middle East Countries: A Case Study in Iran


1
Center for Technology and Society, Technische Universität Berlin, Germany, Kaiserin-Augusta-Alle 104, 10553 Berlin, Germany
2
Department of City and Regional Planning, School of Architecture, Universidad Politécnica de Madrid, Av. Juan de Herrera, 4, 28040 Madrid, Spain
3
Department of Transport and Supply Chain Management, College of Business and Economics, University of Johannesburg, Johannesburg 2006, South Africa
*
Author to whom correspondence should be addressed.
Sustainability 2020, 12(22), 9620; https://doi.org/10.3390/su12229620
Submission received: 12 October 2020
/
Revised: 13 November 2020
/
Accepted: 14 November 2020
/
Published: 18 November 2020
Abstract
:The present study aimed to investigate different socioeconomic factors as well as the perceptions and travel behaviors associated with urban sprawl in two cities of different sizes in Iran, as a developing country in the Middle East. Four Weighted Least Squares (WLS) regression models were developed for Hamedan and Nowshahr, as examples of large and small cities in Iran, respectively. The findings showed different correlations related to urban sprawl between Iranian cities and high-income countries in terms of socioeconomic and travel behavior determinants. Urban sprawl around home in Hamedan was positively correlated with the number of cars and driving licenses in households, the use of a private car for trips, and less use of public transport. Urban sprawl around homes in Nowshahr was related to an increased number of cars, the use of private cars for non-commuting trips, less sense of belonging to the neighborhood, and lower income. Additionally, urban sprawl around workplaces was correlated with main daily activity, number of non-commuting trips, mode of choice for non-commuting, and residential location choice in Hamedan a swell as monthly income, daily shopping area, frequency of public transport use, quality of recreational facilities, length of time for living in the current home, and commuting distance in Nowshahr.
1. Introduction
There is no unique definition for urban sprawl, especially in different socioeconomic contexts. However, it is recognized by low density, single land use, separated land development, and car-dependent areas [1,2,3,4,5,6]. The natural environmental characteristics are shaped by topography and human activity. Also, urban sprawl as a consequence of human environment affects the natural environment [6]. Sprawled usage of land has impacts on air pollution, destruction of green spaces, reduced social interactions, health problems due to increased traffic jams and unsustainable transport modes [7,8], mental health [9], separation of social levels based on income or economic discrimination [10], unsustainable development, unplanned patterns of growth, CO₂ emission [11,12], and energy consumption [13,14,15,16]. Moving towards sustainability requires a better understanding of urban sprawl in different socioeconomic contexts, since urban sprawl is a particular urban built environment related to the requirements of sustainable development goals. It is associated with different social, environmental, and economic aspects of life in cities. Particularly, the aesthetic aspect of open space is lost, natural ecosystems are transformed, and the structure of local communities is destroyed by the sprawled pattern of development [17].
Hence, it is absolutely essential for policymakers to control urban growth based on a sustainable development framework by considering various socioeconomic, cultural, and geographical considerations. Efficient policies should be contextually designed by decision makers and urban planners in different parts of the world.
Urban sprawl is often known as an American urban development pattern [3,18]. Thus, it has mainly been studied in developed countries, especially in the United States and Western European countries [2,19,20,21,22]. It has recently drawn significant attention in developing countries and emerging markets. Several factors, such as rapid urbanization, transformation from agricultural economy to services or industrial sector, the development of infrastructures, and technological improvement, have played essential roles in creating new development patterns like sprawled areas in developing countries [23,24,25,26,27]. The publications on urban sprawl and its relationship with urban mobility usually come from high-income countries. Hence, the experiences and strategies of Western countries with high income and different cultural, geographical, and social conditions have been accepted and applied to emerging countries to tackle problems of urban sprawl. There is scant literature on the modeling and characterization of urban sprawl in developing countries. Recognized as a complicated phenomenon, sprawl should be contextually considered. The study of this phenomenon in different socioeconomic contexts determines its features and helps to provide a better understanding of urban sprawl planning to address its negative consequences based on various social, historical, cultural, and economic conditions.
Therefore, this study aims to shed light on the urban sprawl in developing countries by focusing on the Iranian context as a good example of recently increased dispersed urban patterns in the Middle East.
The objective of this paper is to consider the social and economic features of Iranian life and their impacts on urban built environment, in this case urban sprawl and urban mobility by behavior monitoring to achieve resilient and sustainable cities. More specifically, the present study attempted to characterize urban sprawl for different city sizes in terms of mobility patterns and residents’ socioeconomic features. As mentioned above, one the axes of this study is the contextual differences of urban sprawl based on social and economic behaviors, as well as travel habits and residents’ perceptions to get better understanding of urban sprawl contextually for urban planners and policy makers to achieve sustainability goals.
This paper contributes to urban sprawl literature by modeling urban sprawl in the context of Middle Eastern cities, where the global knowledge on urban sprawl and its association with socioeconomic features and travel behavior is limited. Thus, this paper is novel within the Middle Eastern context as well through its employment of tool-based techniques to quantify disaggregated urban form, urban sprawl, and commuting distance. The unsustainable development pattern and its relationships with mobility and socioeconomic features are less or non-studied topics among small Middle Eastern cities, although Iranian small cities have been confronted with urban sprawl [28,29] recently. To this end, the city of Hamedan, as an example of a large city with over 500,000 inhabitants, and the city of Nowshahr, as an example of a small city with less than 50,000 inhabitants, were chosen. It is noteworthy that large cities (with over 500,000 inhabitants) and small cities (with fewer than 50,000 inhabitants) are defined based on their population in Iran [30].
The rest of this paper is organized as follows. Section 2 provides a comprehensive literature review of the urban sprawl as a societal phenomenon by addressing its previously identified determinants and features in different socioeconomic contexts. Section 3 and Section 4 present the methodology as well as the results and main findings, respectively. Section 5 provides a thorough discussion of the major findings related to urban sprawl and its determinants in Iran as well as the comparison of the obtained results with those of the studies conducted in foreign countries. Finally, Section 6 presents the conclusions and implications.
2. Literature Review
There is no consensus on the key determinants of urban sprawl in previous studies, hence, there are contradictions in defining and measuring urban sprawl [4,21,22,31]. Given the current controversy on its definition, urban sprawl is a multidimensional phenomenon that is related to various variables in different socio-economic contexts. Urban sprawl is a global phenomenon which has made significant changes in land use in both developed and developing countries [32]. In developed countries, urban development has taken place as an important consequence of industrial expansion as well as economic and population growth in the speed commensurate with infrastructure development [33]. Due to different contexts between developed and developing countries, urban strategies and definition of sprawl differ. Developed countries face problems such as transportation, energy, environment, and land use, while developing countries face problems in relation to low levels of economic growth, inefficient planning systems, the underdevelopment of infrastructures, and rapid urbanization [34]. He et al. (2019) compared urban sprawl in Chinese metropolitan areas to American metropolitan areas and analyzed three different types of urban sprawl [34].
Urban sprawl, as a type of urban form and spatial structure, is associated with socioeconomic and travel patterns by considering different cultural, historical, geographical, and economic contexts. The relationship between urban sprawl and its impact on travel behavior has drawn research attention recently [35,36,37,38,39]. Ewing et al. (2018) discussed the relationship between compact development and traffic congestion by employing sprawl metric for American urbanized areas [38]. Handy et al. (2002) argued that there is a link between the characteristics of built environment such as mixed use area, street connectivity, good design, and promoting walking and cycling as transportation modes [36]. Also, Handy et al. (2005) studied the association between travel behavior and built environment characteristics and called for more studies to be conducted based on socio-demographic features to investigate the influence of residents’ attitude on changes in travel behavior and built environment [35]. Considering the determinants of urban sprawl from an economic point of view, Ehrlich et al. (2018) studied this phenomenon in an institutional setting across European countries. The findings indicated that urban sprawl patterns differ based on the country level and institutional factors, and countries with decentralized government systems are more sprawling than those with centralized governments [40]. Ewing et al. (2016) showed that the chance to move to a higher income and social status is higher in compact areas than sprawling areas in American cities [10]. Several factors are associated with urban sprawl, some of which are related to housing preferences such as having more green space, avoiding city center problems, or preferring a detached house with a private garden. The role of green space availability in urban sprawl within the city edge as a driving force is associated with housing preferences [41]. Lee (2020) examined the impacts of urban forms regarding density, land use mix, centeredness, connectivity, and accessibility on transportation outcomes in the United States. The results showed that lesser sprawled areas are associated with more walking commuters, fewer commuting trips with personal cars, lower average commuting time, and more use of public transportation modes [42]. Liu et al. (2019) considered different urban structures and evaluated the relationship between urban spatial structures and CO₂ emission. Their findings indicated that the compact development pattern of urban spatial form is the best model to achieve a balance between economic growth and reduction in CO₂ emission. In addition, there was a relationship between urban forms, socioeconomic factors, and energy consumption [43]. An econometric model and a wide panel dataset combining socioeconomic, urban form, and transportation factors along with the use of remote sense land-use data were employed to examine the impacts of urban forms and socioeconomics on energy consumption in the megacities of China [14]. The findings demonstrated that the rapid urbanization process, urban sprawl, and fragmented or irregularly shaped patterns of urban land use are related to air pollution [14]. The efficiency of public transport in sprawled areas of Spanish cities was studied to provide integrated strategies in land use planning to improve sustainable mobility through car-dependent areas [44]. In another study, the association between the urban structure and socioeconomic effects on travel patterns was investigated by using GIS and collecting spatial data on the participants’ residential location, travel destinations, and travel patterns, such as travel modes, frequency, and travel purpose in Finland [45]. Figueroa et al. (2018) compared spatial structural patterns and the correlation between urban forms and travel behaviors among the elderly (65–84 years old) and younger people (16–64 years old) by using disaggregated data to investigate how population aging contributed to travel patterns in Denmark [46]. The links between socioeconomic features and travel habits such as income, population growth, use of car in commuting trips, employment, and distance from the city center and compact/sprawl areas was analyzed in Melbourne, Australia, by using multilinear regression and Neural Network models [47]. Pucci (2016) studied mode choices and travel habits among residences in the urban region of Milan, Italy, by focusing on peri-urban areas. This paper shows that an understanding of socio-spatial transformations in the urban region of Milan is a key factor for making policies for urban development. Different age groups have different travel behaviors based on the type of their living place [48].
Some studies have explored urban sprawl in developing countries while most studies characterizing this phenomenon have been conducted in developed countries. A study on the relationship of mobility induced with urban sprawl was investigated for Mexican cities to assess differences between developed countries and emerging markets. The results revealed that transportation costs and fuel consumption are higher in sprawled areas than in compacted areas [49]. Acheampong (2020) studied the spatial structure-travel links at the intra-urban level for African cities in Ghana and assessed the relationship between spatial structure, commuting patterns, and travel mode choices. The motorized transport choice was influenced by residence in suburban areas, higher-income commuters, and long commuting distances [50]. Rapid and unplanned urban growth in developing countries, along with the inefficient planning system and inadequacy of political and management systems, led to uneven urban expansion, speculation activity, and peri-urban areas. Urban sprawl emerged in major Egyptian cities in the 1960s mainly due to population growth, economic incentives, access to life facilities, administrative functions, and land demand in Cairo and some other cities [51]. In addition, Ghana has been faced with urban sprawl in nucleated or cluster patterns by concentrating on particular social and income groups or scattered and dispersed forms where physical development is patchy and spread out urban development is ineffective [52]. Both the high natural population growth and the high rate of immigration from rural areas affect the unplanned developments and informal settlements in Kampala, the capital of Uganda, which suffers from inadequate sanitation, unreliable water supply, and inefficient transportation system [53]. In some Asian cities, rapid urbanization along with some improvement plans such as modernization has caused urban development and urban sprawl. For instance, new economic policies have led to the growth of many industrial states around Kuala Lumpur in Malaysia to the extent that the new urban land developments beyond the city boundaries have responded to new demands. Therefore, some areas in the outskirts of Kuala Lumpur have grown faster over the past 20 years [54]. Additionally, urban sprawl resulted in rapid urbanization, modernization, boom construction, and land development in both formal and informal settlements in Turkey between 1950 and 1985 [55]. Amman, the capital city of Jordan, transformed from a small city with a population of 2000–3000 in 1920 to a metropolitan area with more than 2.17 million people in 2006, which led to drastic growth spurts. The physical situation, accelerated growth, and polarized social structure of Amman are considered to be some of the issues of urban development in the Middle East [23].
In Saudi Arabia, the spread of urban sprawl and scattered unplanned development is mainly caused by informal and formal land development [56]. Urban expansion and population growth are mostly associated with economic development, land speculation, and land subdivision in the cities of Saudi Arabia. There are some economic similarities related to urban sprawl in developing countries. However, there are major geographical and social differences. The review of urban sprawl literature indicates an increasing trend of urban sprawl as a specific urban development pattern in developing countries as well as a shortcoming in contextually based investigations on the association between urban sprawl and its socioeconomic features. Although there are many academic studies on the relationship between urban sprawl and mobility, international knowledge suffers from shortcoming in this area in developing and emerging markets. While developing countries have been confronted with urban sprawl recently, the academic investigations are limited by general causes, impacts, and intensity of urban sprawl in shaping land development. Also, publications in developing countries, particularly in the Middle East and South Asia, have applied the census data and secondary data in their methodologies. There are no or less studies to develop models in urban sprawl in context of developing countries and Middle Eastern cities employing primary and disaggregated data as well as quantified urban form features.
Iran, as an important developing country in the Middle East, has witnessed urban sprawl over the past few decades. Hosseini et al. (2019) showed that 36% of the urban spatial expansion in Iran is the result of sprawl in cities between 1986 and 2011 [57]. The observations on urban sprawl in Iran show that this phenomenon has an outward trend in different city sizes, from metropolitan areas and large cities like Tehran [58] and Qom [59] to mid-sized and small cities like Yazd [60] and Kazerun [29]. Several studies investigated factors influencing the urban sprawling of the Iranian cities, including rapid urbanization, inefficient urban planning system, and weaknesses of master plans, modernization, improvement of technology, land speculation, economic forces, and public construction [24,28,57,61]. The boom in urban population is driven by natural population growth and the increased rate of immigration from rural areas to the cities, which leads to the failure of the rural areas in serving their traditional functions in the settlement system of Iran. Improvements in the economic system related to the increased global price of oil attracted government investments to the cities in the 1970s. Hence, the promotion of city life and transition from agricultural to service economy changed the urban structures of the compact traditional to low-density and sprawled neighborhoods [24]. Newly developed areas are located around the compact cores of the cities while new street networks divide the cities into new areas [28]. The use of automobiles, the development of transportation systems, and the excessive price of land in the city incentivize new immigrants to accommodate in periphery areas around the cities. Iranian cities are confronted with a non-organic growth in which spatial growth is much faster than population growth and the real needs of city expansion [62].
Several studies have addressed urban sprawl in Iran [24,29,59,60,61,62]. However, few studies have examined its relationship with travel patterns and socioeconomic determinants in Iranian cities as examples of emerging markets in the Middle East. Urban sprawl has been generally studied with aggregated data without any suitable models to evaluate its correlation with different contextual determinants in the developing countries. However, there is a huge research gap between developed and developing countries. In fact, most studies on urban sprawl have been conducted mostly in developed countries rather than developing countries. Therefore, studies should be conducted to explore the socioeconomic determinants to provide a more comprehensive understanding of this phenomenon in developing countries. The regional and international contributions of this paper are to study urban sprawl and its association with urban travel, residents’ attitude, and socioeconomic features in less studied contexts to provide a clear understanding of urban sprawl in emerging nations, employing disaggregated data on urban sprawl and urban form, as well as quantifying and applying them in the models with less studied variables in the region.
The present study aimed to answer the following research questions:
- Which travel patterns, socioeconomic features, and residents’ perceptions characterize the urban sprawl of Iranian cities? In other words, what are the determinants of urban sprawl in Iranian cities (Hamedan and Nowshahr)? Many factors like culture, economic and social patterns, infrastructure, and political conditions are similar in these two cities.
- To what extent are urban sprawl determinants in Iran similar to and different from the developed countries? This paper tries to determine urban sprawl in different contexts to create a deeper understanding of urban sprawl in emerging nations.
This study assumes that urban sprawl has a correlation with residents’ different socioeconomic features, human perceptions, residential self-selection, and travel behaviors. It is hypothesized that the determinants of socioeconomic and mobility patterns of urban sprawl are contextually different, having different patterns in developing countries based on different social and economic circumstances as well as the development level.
3. Methodology
3.1. Case Study
As mentioned in Section 2, urban sprawl in Iran has emerged in not only large cites but also medium-sized and small cities. In this study, the effect of city size is examined on residents’ socioeconomic features and travel patterns associated with urban sprawl areas in two Iranian cities, namely, Hamedan and Nowshahr.
The cities in Iran are categorized based on a population threshold. Small cities are those with less than 50,000 inhabitants while mid-small cities have between 50,000–100,000 inhabitants. In addition, middle-sized and mid-large cities have 100,000–250,000 and more than 250,000 inhabitants, respectively. Finally, large cities and metropolitan areas have more than 500,000 and 1 million inhabitants, respectively [30].
In this paper, Hamedan was selected as a large city with 655,859 population in 2016 based on official population and housing census. It is the capital city of Hamedan Province and located in the northwest of Iran in a mountainous area. Hamadan has been developed based on demographic growth throughout historical life. This city has experienced rapid expansion and urban sprawl since 1976. The city area tripled from 1976 to 1996 [63]. Hamedan has confronted unplanned urban growth and converted gardens and green spaces around the city for development while there are still capacities for development in the inner city [64]. Bakhtiari et al. (2013) investigated urban sprawl in Hamedan using Shannon entropy and found that 45.66% of the physical growth of the city was sprawled in 1976 to 2006 [63]. Taleshi et al. (2018) studied the physical transformation from rural to city areas and urban sprawl in Hamedan [65]. Physical–spatial transformations indicated that sprawl in periphery areas of Hamedan happened in two major levels, namely, authorized area and outside ones. Furthermore, rural areas in the vicinity of Hamedan have experienced a sprawl over the past 20 years. Therefore, the city has been extended in order to join the sprawled rural areas. In fact, Hamedan could be considered a good example of a large Iranian city with urban sprawl.
Nowshahr is a small, northern coastal city with a population of 49,403 according to the official population and housing census in 2016. The geographical location of this port city is very important due to its coastline with green forest areas. Access to green space, proximity to the coastal line, and short distances between the cities and rural areas in the north of Iran have caused the sprawled pattern of development of small cities and rural areas in the north of Iran [66]. Due to the increased investments in housing and transformation of the economy from agricultural to service, many rural people in the northern cities of Iran immigrate to nearby cities. Over the past few decades, many farms have been sold and used as a second house for high-income people. Nowshahr has faced rapid physical growth since 1970 because of its high immigration rate [66]. Urbanization in Nowshahr was based on the pattern of attaching rural areas to the main city in border areas.
3.2. Data Collection
A total of 1000 questionnaires were filled in via face-to-face interviews in the winter of 2019 in Hamedan and Nowshahr. There was no official disaggregated data on mobility patterns as well as the residents’ perceptions and socioeconomic features. In addition, Iranian people are more cooperative in face-to-face interviews as compared to online or postal questionnaires. In this study, Hamedan and Nowshahr were considered as large and small cities, respectively.
The present study was conducted at a micro scale. In each city, 500 questionnaires were equally and randomly distributed in sprawled and compacted neighborhoods among the residents. The questionnaires were completed by the interviewers.
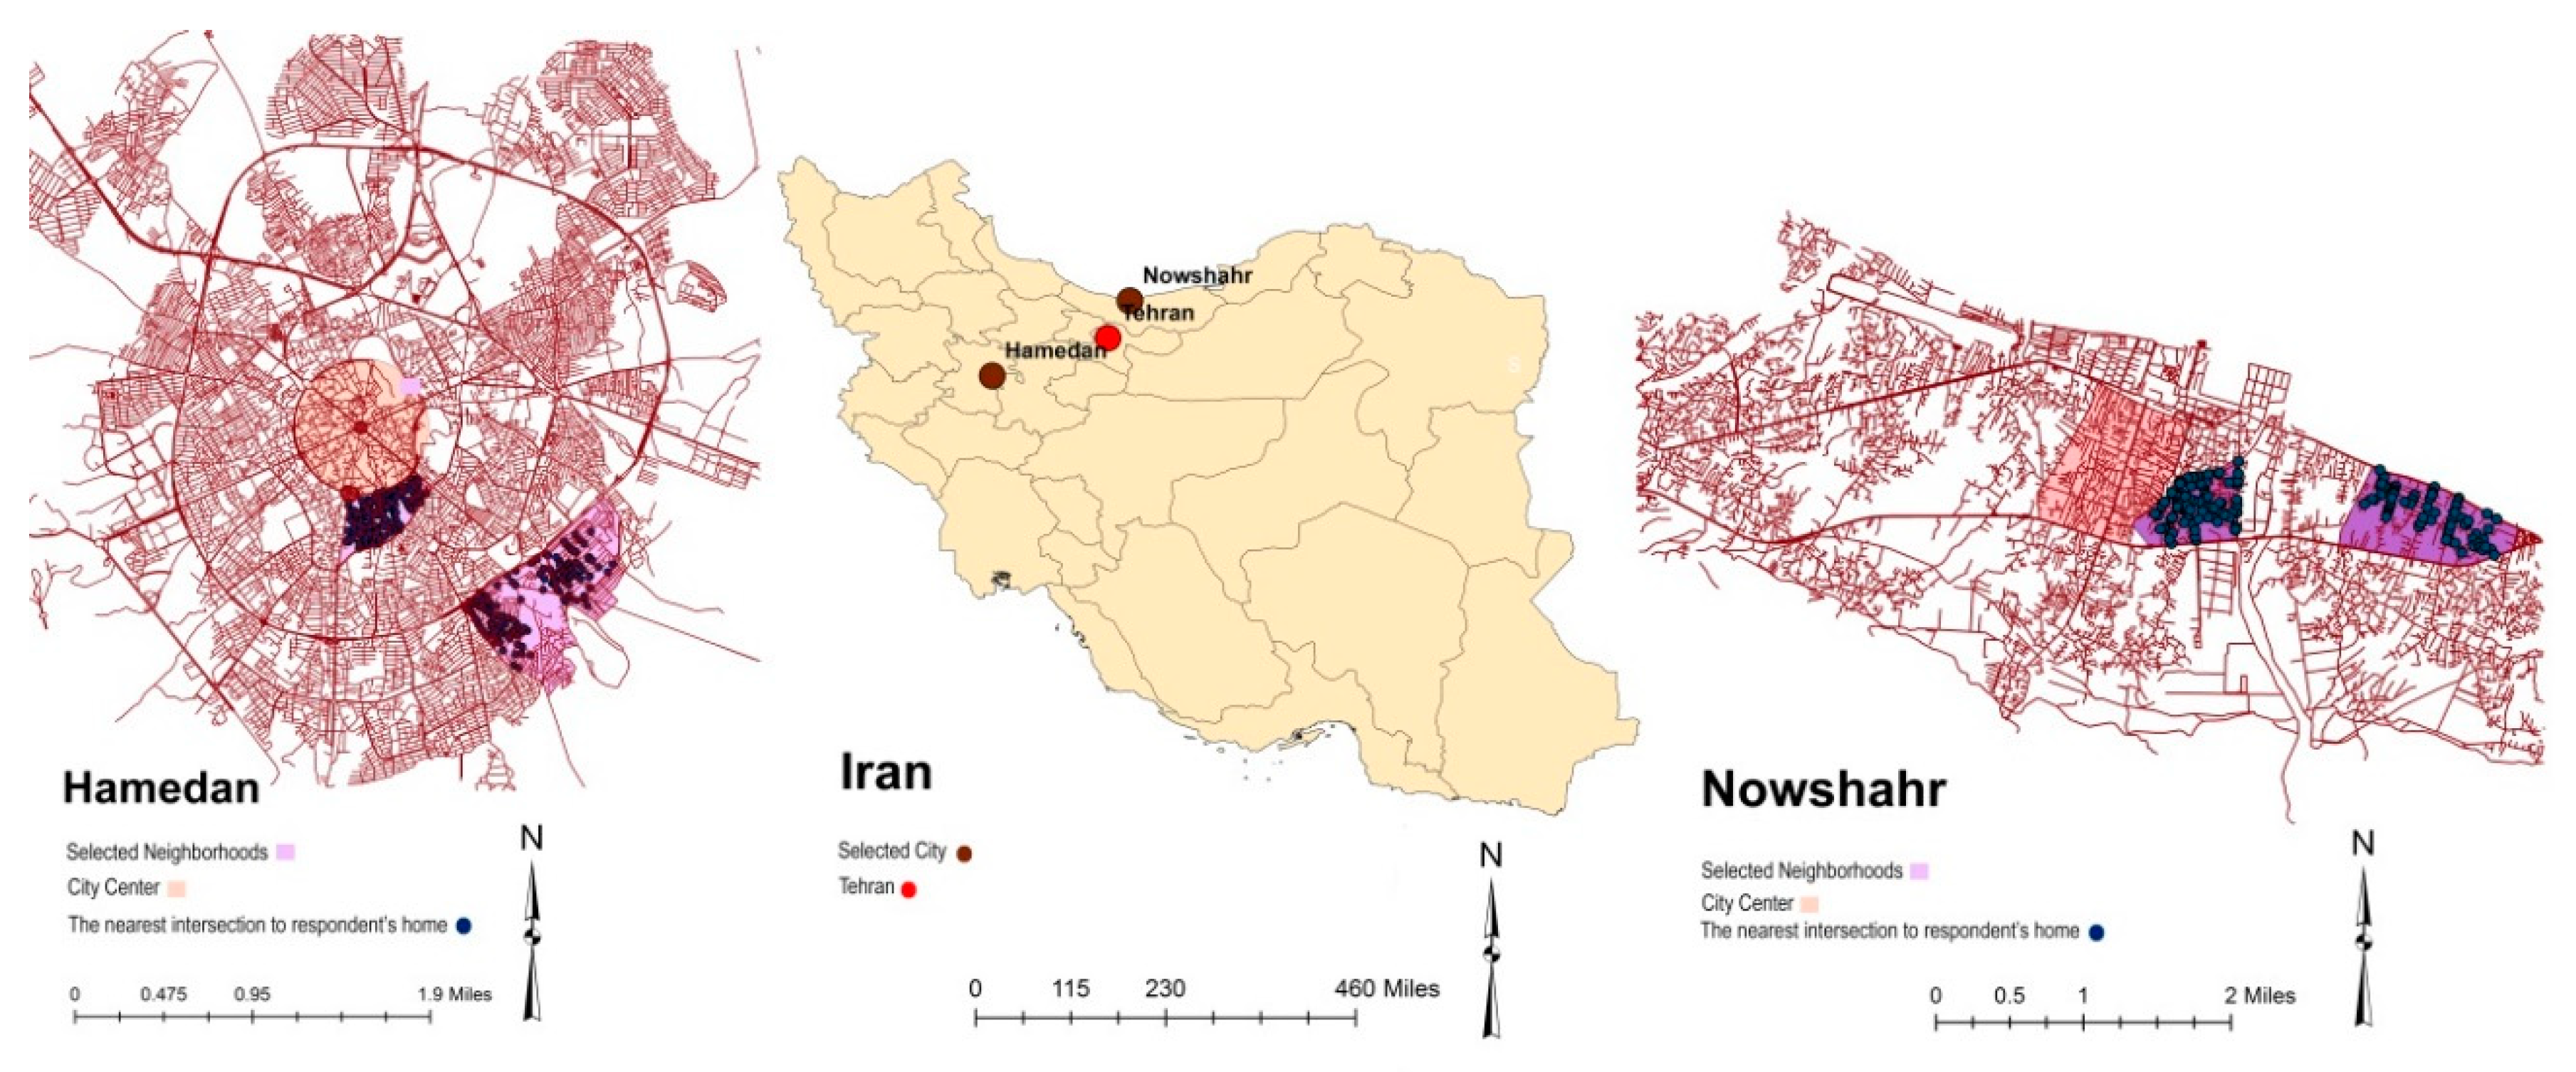
The sample size for each city was 500 respondents, which is larger than the size estimated by Cochran (1963) with a confidence level of 95% [67]. Thus, the confidence intervals for Hamedan and Nowshahr based on population and sample size were 4.38 and 4.36, respectively. In addition, two neighborhoods were highlighted in each city to represent the sprawled and compacted areas (Figure 1). The sprawled and compact neighborhoods were selected based on density, distance to the core city, and land use structure. Compact neighborhoods have a higher building density, lower rate of vacant lots between buildings, mixed land-use, and less distance to the core city compared to sprawled neighborhoods.
The questionnaire had four sections including 24 items on the respondents’ socioeconomic features, travel patterns, perceptions about their neighborhood, and residential location choice. The questionnaire was translated to Persian and administered through face-to-face interviews. The socioeconomic variables, namely, age, gender, main daily activity, driving license, number of driving licenses in the household, number of cars in the household, and monthly income were directly extracted from the questionnaires. The number of commuting and non-commuting trips per week, main transport modes for commuting and non-commuting purposes, and frequency of public transit use were collected to determine travel behaviors of the residents in these two cities. Another group of questions was designed to probe the respondents’ perceptions about their neighborhoods including the quality of social and recreational facilities, the attractiveness of shops and commercial centers, and their preferred place for entertainment and shopping. Finally, the participants were asked to indicate the main reason for choosing their residential location by selecting from different options such as affordability to buy, proximity to work or relatives, existence of an attractive environment, traditional belonging to the neighborhood, etc. Table 1 shows all the data collected via the questionnaires.
3.3. Data Analysis Method
Initially, multiple Ordinary Least Squares (OLS) and Weighted Least Squares (WLS) modeling attempts using socioeconomic and travel pattern predictors were made. Eventually, WLS regression model resulted in a better fit than OLS. Hence, four Weighted Least Squares (WLS) regression models were developed in IBM SPSS (version 22) to analyze the urban sprawl correlation with the respondents’ socioeconomics features and travel patterns in Hamedan and Nowshahr. Urban sprawl was considered as a dependent variable in each model.
Shannon entropy was used to measure the urban sprawl for each participant indicating his/her home and workplace in the attached maps. The nearest intersections to home and workplace were chosen instead of their exact locations to avoid the violation of the participants’ privacy. Shannon entropy, as a scientific and reliable metric for measuring urban sprawl, has been used in several studies [22,68,69]. To compute the disaggregated urban sprawl, the land use maps of Hamedan and Nowshahr were classified into two main classes including built-up and non-built-up areas in order to gain a better disaggregated amount of Shannon entropy. The cities were divided into 1440 and 338 equal fishnet grids with sides of 400 m. Shannon entropy was calculated by using spatial analysis tools in Arc-GIS (version 10.3) based on the growth of built-up areas.
The value of entropy, always between 0 and log (n), is calculated by the following equation:
where represents the proportion of built-up area in the one ( n is the number of zones, and is the observed value of phenomenon in the zone [70].
After measuring Shannon entropy for each equal square in Hamedan and Nowshahr, the points representing homes and workplaces were converted to zonal maps of the entropy to determine the amount of Shannon entropy for each point. The percentages of Shannon entropy are presented in the models.
In this paper, link density was selected as the weighted variable in the WLS regression model with a confidence level of 95% and a p value of 0.05. According to the European Environment Agency(EEA) analysis in 2016 for European countries, increasing the road density has the same direction as the increase of the urban sprawl, so an increase in the length of streets is considered as a major promoter of the dispersion of built-up areas. In other words, the possibilities for residential developments far away from the city center can increase and decrease in connectivity between two land use such as homes and destination for work or recreational activities. Hence, urban sprawl literature emphasizes the increased length of street network could lead to higher dependence on automobiles and longer distance to central facilities, which increases urban sprawl [15]. EEA report (2016) confirmed a positive correlation between road density and urban sprawl in European countries [15].
Link density was calculated for each home and workplace in 600 m of the catchment areas around the houses and workplaces using Arc GIS (version 10.3). The length sum for street network in the catchment area was divided into the catchment area.
Two WLS regression models were separately applied for homes and workplaces to answer the main research questions and determine the association between urban sprawl and the respondents’ socioeconomic features and travel patterns. First, WLS regressing was developed with some variables such as age, gender, main daily activity, driving license, number of driving license in household, the number of cars in household, gross monthly income, number of commuting trips, main transport mode for commuting trips, number of trips for shopping or entertainment, daily shopping area, mode choice for shopping and entertainment inside and outside the neighborhood, frequency of public transit use, sense of belonging to neighborhood, attractiveness of shops, entertainment place, quality of social/recreational facilities, residential location choice, and length of time living in the current home. In the second step, variables were respectively omitted to obtain significant models based on high amount of p until only variables with p < 0.10 remained in the models. Regarding the city of Hamedan, urban sprawl around the residences was significantly correlated with 14 variables after removing variables with less significance, including the attractiveness of shops in the neighborhood, length of time living in the current home, residential location choice, gender, number of commuting trips, number of trips for shopping and entertainment, preference for entertainment place, commuting distance, main daily activity, and the household monthly income. In addition, the model of urban sprawl around the workplace in Hamedan had a highly significant correlation with socioeconomic, perceptions, and travel pattern variables after repeating the models 17 times to eliminate less significant variables such as driving license, main transport modes for commuting, gender, number of commuting trips, quality of social and entertainment facilities in the neighborhood, number of cars in the household, monthly income of the household, preference for entertainment place, frequency of public transport use, mode choice in shopping and entertainment in the neighborhood, sense of belonging to the neighborhood, commuting distance, attractiveness of shops, length of time for living in the current home, number of driving licenses in the household, age, and daily shopping area.
The WLS regression model around the residences in Nowshahr was developed with 10 statistically significant variables after respectively removing less significant variables such as the length of time for living in the current home, frequency of public transport use, gender, number of driving licenses in the household, main transport mode for commuting, preference for entertainment place, residential location choice, attractiveness of shops, number of trips for shopping and entertainment, driving license, and daily shopping area. To generate the WLS regression model around the workplace in Nowshahr, 15 variables were respectively omitted based on the high amount of p including gender, age, number of cars in the household, number of driving licenses, preferences for the entertainment place, number of commuting trips, driving license, attractiveness of shops, mode choice for shopping and entertainment trips outside the neighborhood, sense of belonging to the neighborhood, age, main transport mode for commuting, main daily activity, mode choice for shopping and entertainment place in the neighborhood, number of trips for shopping and entertainment, and residential location choice.
4. Result
4.1. Descriptive Analysis
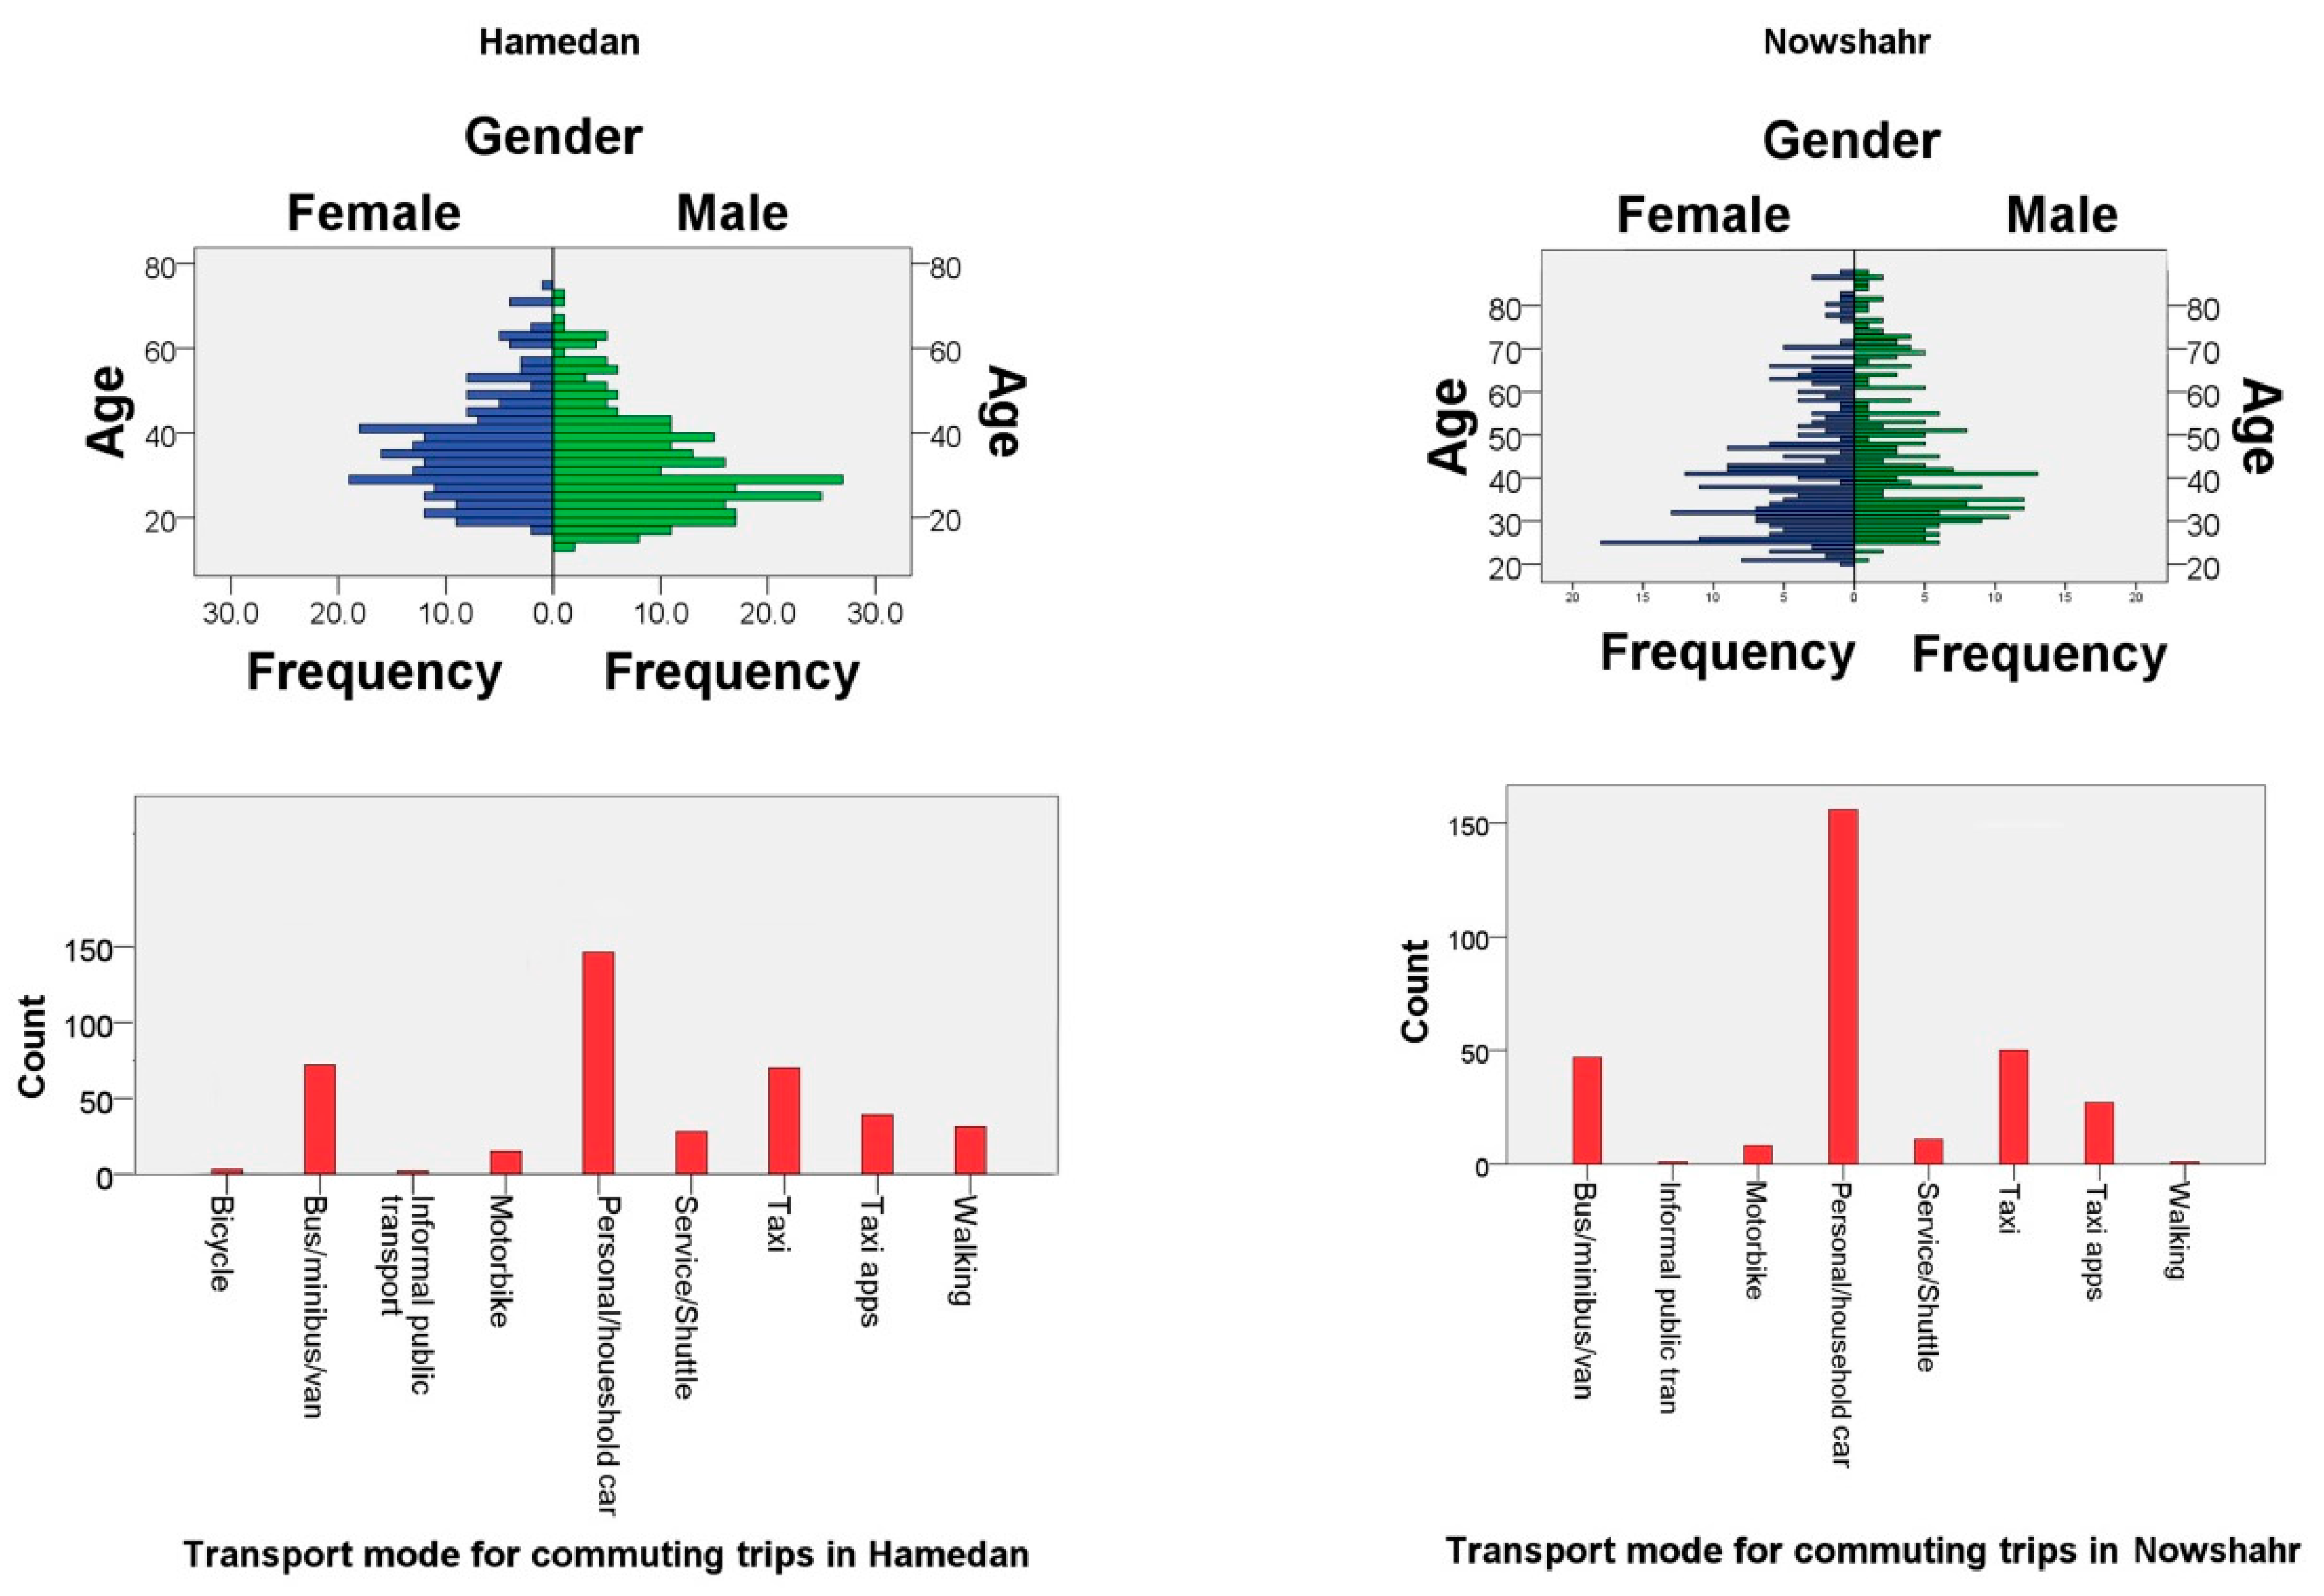
In Hamedan, 56% of the participants were men while 44% were women. In Nowshahr, 47% and 53% of the respondents were men and women, respectively. The minimum age of the participants in Hamadan was 13 while the maximum age was 75. In Nowshahr, the youngest and the oldest participants in the survey were 17 and 84 years old, respectively. The Shannon entropy percentage around the residences ranged between 0 and 0.26 for Hamedan and between 0 and 0.30 for Nowshahr. In addition, the minimum and maximum Shannon entropy around the workplace in Hamedan was 0 and 0.59, while they were 0 and 0.54 for the city of Nowshahr, respectively. The average monthly incomes of the participants’ households in the survey were 595.20 and 685.96 Euros in Hamedan and Nowshahr, respectively, in 2019 (The figures of monthly income for household were converted to Euro from Rial (Iranian currency) according to the proportion of these two currencies on 1 December, 2019 (time of data collection)). The private automobile was the main transport mode for 29.2% of the people in Hamedan and 31.2% of the residents in Nowshahr. Additionally, the use of cars was the main transport mode for non-working trips outside the neighborhood with 55.2% in Hamedan and 76% in Nowshahr. The statistic descriptions of some continuous variables are shown in Table 2.
Buses, minibuses, vans, and taxies were the second rank of uses as transport modes for commuting trips in Hamedan and Nowshahr. Non-motorized transport modes were less significant transport modes. In addition, 9.4% in Hamedan and 5% of the participants in Nowshahr thought the quality of social and recreational facilities in their neighborhood was not attractive. Furthermore, 28.4% and 59.6% of the participants found the attractiveness of social and recreational facilities as ‘medium’ in Hamedan and Nowshahr, respectively. Furthermore, 77% of the participants in Hamedan and 87.8% of the participants in Nowshahr had a sense of belonging to their neighborhoods. Figure 2 shows frequency of some categorical variables in Hamedan and Nowshahr.
4.2. The Weighted Least Square (WLS) Model for Urban Sprawl around Home in Hamedan
The WLS regression model was generated for urban sprawl around residences by 10 highly significant variables including age, driving license, number of driving licenses in the household, number of cars in the household, mode of transportation for commuting trips, mode choice for shopping and entertainment trips inside and outside the neighborhood, frequency of public transport use, sense of belonging to the neighborhood, and quality of social facilities in the neighborhood after eliminating variables with p > 0.10. In the model, variables with p < 0.05 had highly significant correlations with urban sprawl while those with 0.05 < p < 0.10 were marginally significant. Hence, mode choice for shopping and entertainment outside the neighborhood had a marginally significant association with urban sprawl around home in Hamedan while the other variables in the model were highly significant (Table 3). According to the WLS Model for urban sprawl around home in Hamedan, inhabitants who used their private cars for work and non-work purposes probably lived in the sprawled neighborhoods. People in compact neighborhood might use public transportation more frequently than those in sprawled neighborhoods. People living in the sprawled neighborhoods were likely to have less sense of belonging to their neighborhood than those living in compacted neighborhoods. R² and F test results are presented in Table 3. F = 1321.57 and p < 0.001 and indicate a good fit of the results. In addition, R² is 97.2%, which is a very good percentage of variance between socioeconomic and travel pattern determinants of urban sprawl estimated by the model.
4.3. The Weighted Least Square (WLS) Model for Urban Sprawl around Workplace in Hamedan
The urban sprawl around workplace in Hamedan had a highly significant correlation with main daily activity, number of trips for shopping, mode choice for shopping and entertainment trips outside the neighborhood, and residential location choice. There was no variable with a marginal significance in the WLS regression model. The number of trips for shopping and entertainment had a negative correlation with urban sprawl around the workplace. In addition, the residential location choice was positively associated with urban sprawl around workplace in Hamedan, which shows that people working in sprawled areas, as compared to those in compacted areas, had a stronger preference for choosing a house near their workplace. The WLS model for urban sprawl around workplace in Hamedan is shown by Table 4. R² = 93.4% and F-test = 1049 (p <0.001) indicate a good model fit and high percentage of variance between the variables generated by the WLS regression model for urban sprawl around the workplace in Hamedan.
4.4. The Weighted Least Square (WLS) Model for Urban Sprawl around Home in Nowshahr
The WLS regression model was developed for urban sprawl around home with 10 highly significant variables including age, main daily activity, number of cars in household, monthly income of the household, mode choice for shopping and entertainment trips inside and outside the neighborhood, sense of belonging to the neighborhood, quality of social and recreational facilities in the neighborhood, and commuting distance. All variables applied in this model had p < 0.05, which indicated that there was no variable with a marginally significant correlation. Hence, the variables with p > 0.10 were respectively omitted based on the higher p amount. Urban sprawl around homes in Nowshahr had a negative correlation with the monthly income of the households, which indicates that more low-income people probably lived in sprawled neighborhoods with less sense of belonging to their neighborhoods than those living in compacted neighborhoods. The number of cars in households correlated with urban sprawl around home in Nowshahr, which could be related to the fact that the inhabitants had more cars in the sprawled neighborhoods. In addition, people living in the compacted neighborhood were younger than those living in the sprawled areas in Nowshahr. Table 5 shows WLS model for urban sprawl around home in Hamedan. The F-test = 707.15 (p < 0.001) and R² = 96.5% confirm that the model has a strong predictive power for the variances of socioeconomic and travel pattern determinants of urban sprawl around the home in Nowshahr.
4.5. The Weighted Least Square (WLS) Model for Urban Sprawl around Workplace in Nowshahr
As shown in Table 6, there is no variable with 0.05 < p < 0.10, all variables in the model have p < 0.05, and there is no variable with a marginally significant correlation in the model. Hence, the WLS regression model for urban sprawl around the workplace in Nowshahr had a high significant correlation with six socioeconomics, travel pattern, and perceptions of determinants including monthly income per household, daily shopping area, frequency of public transit use, quality of social and recreational facilities, length of time for living in the current home, and commuting distance. The quality of social and recreational facilities and the length of time for living in the current home had the strongest and weakest correlation in the regression model for urban sprawl around workplace in Nowshahr, respectively. The household monthly income had a positive association with urban sprawl in the model, indicating people working in sprawled areas were more likely to have a higher monthly income. This WLS model could predict 91.4% of the variance in the socioeconomic and travel behavior determinants of the urban sprawl. The F-test result confirms the validity of the predictive power of the model.
5. Discussion and Implications for Policy Making
The term sprawl often refers to inefficiencies in development, disproportionate growth of urban areas, and upward leapfrog development. The sprawled pattern of development affects the social and natural environment by unsustainable development, decreased social interaction, increased automobile use, CO₂ emission, increased traffic jams, destruction of natural resources, social class separation, etc. American scholars investigated urban spatial structures, land use policies, the equilibrium between costs in living suburbanization and commuting costs, property taxes, and governmental policies as causes of urban sprawl [70]. Nechyba et al. (2004) compared theories of monocentric model, Tiebout models, and models of edge cities and discussed the shortcomings in second-best considerations in urban models to make urban policies more efficient [70]. Nevertheless, the overall understanding about the nature and determinants of urban sprawl come from developed countries. Thus, there is a gap in research on this phenomenon in developing countries. Despite the similar characteristics of urban sprawl around the world, there are some variations between the determinants in developed and developing countries based on economic conditions, as well as among the countries with the same level of development according to different cultural, social, and geographical contexts.
In the present study, four models were developed to predict the explanatory variables of urban sprawl at the micro scale by employing disaggregated urban sprawl models. Various dimensions of urban sprawl such as definition, causes, measurements methods, and its effects on the environment have been studied. A few studies analyzed urban sprawl based on models and investigated socioeconomic variables as well as the inhabitants’ perceptions and travel patterns. Despite the growing body of studies on urban sprawl and travel behavior in developing countries, the results are inconclusive and more comprehensive investigations are required. This study explored the association between urban sprawl in Iranian cities and some under-researched variables such as sense of belonging to the neighborhood, residential location choice, quality of social and recreational facilities in the neighborhood, and length of time for living in the current home. The rest of the significant variables including income, mode choice in work and non-work travels, frequency of public transport use, the number of commuting trips, and commuting distance were the focus of previous studies, and their role was confirmed in this study. For example, urban sprawl around the home in Nowshahr correlated with employment rate, which is in line with the report of the European Environment Agency indicating the positive effect of the employment rate on Western European and the Mediterranean Sea coast countries [15]. The inverse correlation of employment rate in the urban sprawl around the workplace in Hamedan is consistent with the negative association between urban sprawl and the employment rate in three Scandinavian countries [15]. This pattern can be observed for the number of cars in the household. Urban sprawl around the home in Nowshahr is positively correlated with the number of cars in the household and confirms the results for European countries, with the exception of Scandinavian countries in the report of EEA. In addition, the negative relationship between urban sprawl around home and the number of cars in households in Hamedan confirms the result of ‘cars per inhabitants’ for urban sprawl in Scandinavian countries [15]. Different directions of the correlations of the urban sprawl with employment rate in this study could be due to the traditional agglomeration of jobs and workplaces in the city center of Hamedan following a radial development pattern in the history of city extension while Nowshahr is located in the neighborhood of the Caspian Sea. Thus, Nowshahr has developed in corridor forms.
The results of the present study indicated a positive correlation between age and urban sprawl around home in Hamedan and Nowshahr, which is in line with the EEA report about the European countries [15]. Additionally, the negative relationship between the urban sprawl around workplace and frequency of public transportation use is in line with the results of the study on urban sprawl and its correlation with the percentage of commuters using public transportation in metropolitan areas of the United States [42]. Furthermore, the positive correlation between urban sprawl and the households’ monthly income is inconsistent with the results of the study on the socioeconomic drivers of urban sprawl in different urban sizes of China. The positive correlation of economic development by using the influence of Gross Domestic Product (GDP) and industry on GDP with urban sprawl was confirmed for different sizes of cities in China as an important influence driver of urban sprawl [71]. The household monthly income was significant in the urban sprawl of Nowshahr while it was not a good predictor of urban sprawl in Hamedan. Income had a negative association with urban sprawl around home in Nowshahr. In fact, lower-income households probably lived in compacted neighborhoods, which is consistent with the findings of the study in Stockholm, Sweden, where lower-income citizens lived in dense neighborhoods while higher-income citizrns were willing to live in houses with private gardens in the outskirts of the city [72]. Despite the positive association between the household monthly income and urban sprawl around workplace in Nowshahr, it could be concluded that people with higher income are more likely work in sprawled neighborhoods since they can afford the commuting costs. The urban sprawl around home in Nowshahr is negatively correlated with the number of commuting trips, which is inconsistent with the positive correlation of the urban sprawl and the number of outbound and inbound commuters in metropolitan areas in Switzerland [73]. However, these findings are in line with the reverse direction between commuting trips and living in outer-suburban areas in Ghana [50]. The findings on urban sprawl around home are in line with the result of Kumasi, where the positive relationship between using private cars in commuting trips and living in the sprawled neighborhood was observed [50], and are also consistent with the result of study on metropolitan area of Madrid that indicated cars are the dominant mode choice in the most commute travels to suburban of Madrid [74]. The association of urban sprawl around home and workplace in Nowshahr is inconsistent with the positive association of urban sprawl and commuting distance in Beijing (China) [75].
The negative association between the commuting distance and urban sprawl around home and workplace in Nowshahr is in agreement with the study of suburbanized employment and short distance for commuting in metropolitan areas in the United States [76].
The results indicated different significant explanatory variables between Hamedan and Nowshahr. These differences could be explained by differences in sizes, geographical location, and urban development history. Nowshahr, located in green spaces, is a small city along the Caspian Sea coastline. Many rural areas near Nowshahr have caused leapfrog development and rapid immigration. The process of immigration from rural to urban areas has gradually happened in Hamedan. Nowshahr has more natural advantages for living in the green outskirts, which has drawn the investors’ attention for construction activities. However, the positive association of age with urban sprawl, the different directions of correlations between income, employment rate, number of cars in household, and several significant variables were presented in the WLS models for both cities.
Some determinants of urban sprawl in Iran are similar to the developed countries. The result indicated different consequences between socioeconomic and travel behavior determinants of urban sprawl in Iranian cities and high-income countries. Therefore, socioeconomic conditions in different parts of the world can affect urban sprawl. In addition, cultural, social, and geographical factors play a significant role in urban development, which calls for the contextual analysis of the urban sprawl phenomenon.
Sustainable urban expansion has become a solution for urban growth in rapid urbanization. The findings of the present study suggest that urban sprawl in Hamedan could create greater demands for using cars for both work and non-work trips, which could increase environmental problems, traffic jams, and energy consumption. Therefore, policy makers and urban planners should take significant measures to improve the public transport infrastructures, enhance the efficiency of public transport system, set more restrictions for private motorized vehicles, create safe and suitable routes for walking and cycling, promote the use of sustainable mode choice in work and non-work trips, and integrate workplaces and recreational facilities with residential neighborhoods.
The findings indicated a negative correlation between urban sprawl and commuting distance in Nowshahr. Hence, urban planners and decision makers should consider the distribution of employment clusters and jobs in sprawled and marginal areas. The decentralization of jobs could provide good opportunities for choosing home near the workplace, which could shorten the commuting distance. Low-income inhabitants in Nowshahr with a lesser sense of belonging to their neighborhoods lived in the sprawled neighborhood. The government should increase the quality of facilities in the sprawled neighborhoods and pay more attention to the qualitative and quantitative development of public transport. Private cars are increasingly used in Iran due to the low price of fuel, low tax rate on automobiles, inefficiency of public transportation system, and social and cultural restrictions on using bicycles and other sustainable transportation modes such as scooters for women. Urban sprawl in this study was highly correlated with the use of private automobiles. Hence, considering urban sprawl in Iranian cities is highly dependent on planning for sustainable modes of transportation.
The urban sprawl phenomenon should be contextually examined according to different socio-economic, cultural, and geographical circumstances in different parts of the world. Urban sprawl in Hamedan had both similarities and differences with Nowshahr. Therefore, urban planners and decision makers can combat urban sprawl in Iran by considering socioeconomic variables, the residents’ perceptions and travel patterns, and urban form variables based on size of the cities as well as their urbanization history and geographical location.
6. Conclusions
The findings of this study shed light on the urban sprawl and its under-researched determinants in two cities of Iran as a developing country in the Middle East. In addition, two models for urban sprawl were developed, which could be used in the urban planning system to address the negative consequences of urban sprawl. Additionally, an increase in age, number of driving licenses in the household, and motorized travel in commute and non-commute trips by private car are correlated with the increased probability of urban sprawl around home in Hamedan. This indicates that inhabitants who lived in sprawled areas probably prefer driving by private cars and they used less public transit than those who lived in compacted areas. Urban sprawl around home in Nowshahr had a positive correlation with age, higher number of cars in the household, lower income, smaller number of commuting trips, mode choice in non-work trips, less sense of belonging to the neighborhood, higher quality of facilities, and less commuting distance. The results in Nowshahr, as well as Hamedan, confirm inhabitants in sprawled areas are more dependent on cars in their non-commuting trips. Hence, urban policies could address negative aspects of sprawled neighborhoods by designing mix-land use such as integrating workplaces with residential areas, and safe routes for walking and biking, as well as enhancing the quality of public transit. Also, knowing sociodemographic characteristics of residences in sprawled areas in Iranian cities could help decision makers and urban planners to have a clear understanding of the characteristics of the inhabitants in these areas to avoid make general policies based on developed countries. Furthermore, the results indicated people in the sprawled workplaces in Hamedan were more likely to choose their residential location based on proximity to their workplaces. Similarly, more high-income people in Nowshahr worked in the sprawled workplaces than low-income inhabitants and live in their neighborhoods for fewer years. The distribution of workplaces in residential neighborhoods instead of solo-residential neighborhoods could decrease commuting distance and the use of an active mode choice.
Urban sprawl is an under-researched phenomenon in developing countries. Urban sprawl in Iranian cities has been studied by geography researchers evaluating its intensity by employing land cover change. Therefore, there were no comprehensive studies specifying urban sprawl in Hamedan and Nowshahr. The recognition of the mechanism of urban sprawl in Iran was limited to fewer studies which evaluated the whole country. The urban mobility and socioeconomic determinants of urban sprawl are not studied in the context of Iranian cities. These determinants can help decision makers and urban planners to gain a deeper and clearer understanding of urban sprawl for setting efficient policies based on real needs.
Future studies should contextually focus on urban sprawl, socioeconomic variables, and travel patterns since these phenomena could be different within the cities of the same country. Additionally, for a better understanding of urban sprawl, further research should be conducted in cities with different sizes and geographical locations. More studies should specify and model urban sprawl according to different socioeconomic, travel patterns, and urban variables at a micro scale by employing disaggregated data in both developing and developed countries. The growing body of literature on urban sprawl is mainly limited to measurement and evaluation of its effects. These studies have created a good framework to study the drivers of urban sprawl as an economic, governmental, social, and technological phenomenon at a macro level. Therefore, further research should contextually evaluate urban sprawl at a micro scale to provide reliable results for overcoming the negative consequences of this universal phenomenon. Furthermore, other reliable predictors of urban sprawl in Iranian cites could be obtained through more in-depth studies.
Author Contributions
Conceptualization, M.M., and H.M.; methodology, M.M., and H.M.; software, M.M.; validation, M.M., H.M. and I.M.; formal analysis, M.M.; investigation, M.M.; data curation, M.M.; writing—original draft preparation, M.M.; writing—review and editing, M.M., H.M., and I.M.; visualization, M.M.; supervision, H.M., I.M.; project administration, M.M.; All authors have read and agreed to the published version of the manuscript.
Funding
This research received no external funding.
Conflicts of Interest
The authors declare no conflict of interest.
References
- Pirotte, A.; Madre, J.-L. Determinants of Urban Sprawl in France. Urban Stud. 2011, 48, 2865–2886. [Google Scholar] [CrossRef]
- Galster, G.; Hanson, R.; Ratcliffe, M.R.; Wolman, H.; Coleman, S.; Freihage, J. Wrestling Sprawl to the Ground: Defining and measuring an elusive concept. Hous. Policy Debate 2001, 12, 681–717. [Google Scholar] [CrossRef]
- Ewing, R. Is Los Angeles-Style Sprawl Desirable? J. Am. Plan. Assoc. 1997, 63, 107–126. [Google Scholar] [CrossRef]
- Cutsinger, J.; Galster, G.; Wolman, H.; Hanson, R.; Towns, D. Verifying the multi-dimensional nature of metropolitan land use: Advacing the understanding and measurement of sprawl. J. Urban Aff. 2005, 27, 235–259. [Google Scholar] [CrossRef]
- Brueckner, J.K. Urban Sprawl: Diagnosis and Remedies. Int. Reg. Sci. Rev. 2000, 23, 160–171. [Google Scholar] [CrossRef]
- Bengston, D.N.; Fletcher, J.O.; Nelson, K.C. Public policies for managing urban growth and protecting open space: Policy instruments and lessons learned in the United States. Landsc. Urban Plan. 2004, 69, 271–286. [Google Scholar] [CrossRef]
- Ewing, R.; Meakins, G.; Hamidi, S.; Nelson, A.C. Relationship between urban sprawl and physical activity, obesity, and morbidity-update and refinement. Health Place 2014, 26, 118–126. [Google Scholar] [CrossRef] [Green Version]
- Ewing, R.; Brownson, R.C.; Berrigan, D. Relationship between urban sprawl and weight of United States youth. Am. J. Prev. Med. 2006, 31, 464–474. [Google Scholar] [CrossRef] [Green Version]
- Garrido-Cumbrera, M.; Gálvez Ruiz, D.; Braçe, O.; López Lara, E. Exploring the association between urban sprawl and mental health. J. Transp. Health 2018, 10, 381–390. [Google Scholar] [CrossRef]
- Ewing, R.; Hamidi, S.; Grace, J.B.; Wei, Y.D. Does urban sprawl hold down upward mobility? Landsc. Urban Plan. 2016, 148, 80–88. [Google Scholar] [CrossRef] [Green Version]
- Shi, K.; Xu, T.; Li, Y.; Chen, Z.; Gong, W.; Wu, J.; Yu, B. Effects of urban forms on CO2 emissions in China from a multi-perspective analysis. J. Environ. Manag. 2020, 262, 110300. [Google Scholar] [CrossRef]
- Han, J. Can urban sprawl be the cause of environmental deterioration? Based on the provincial panel data in China. Environ. Res. 2020, 189, 109954. [Google Scholar] [CrossRef] [PubMed]
- Tao, Y.; Zhang, Z.; Ou, W.; Guo, J.; Pueppke, S.G. How does urban form influence PM2.5 concentrations: Insights from 350 different-sized cities in the rapidly urbanizing Yangtze River Delta region of China, 1998–2015. Cities 2020, 98, 102581. [Google Scholar] [CrossRef]
- Wang, S.; Liu, X.; Zhou, C.; Hu, J.; Ou, J. Examining the impacts of socioeconomic factors, urban form, and transportation networks on CO2 emissions in China’s megacities. Appl. Energy 2017, 185, 189–200. [Google Scholar] [CrossRef]
- Hennig, E.I.; Soukup, T.; Orlitova, E.; Schwick, C.; Kienast, F.; Jaeger, J.A. Urban Sprawl in Europe—Joint EEA-FOEN Report; European Environment Agency (EEA): København, Denmark; Swiss Federal Office for the Environment (FOEN): Ittigen, Switzerland, 2016. [Google Scholar] [CrossRef]
- Duvernoy, I.; Zambon, I.; Sateriano, A.; Salvati, L. Pictures from the other side of the fringe: Urban growth and peri-urban agriculture in a post-industrial city (Toulouse, France). J. Rural Stud. 2018, 57, 25–35. [Google Scholar] [CrossRef]
- Johnson, K.M.; Brown, D.G.; Loveland, T.R.; Theobald, D.M. Rural Land-Use Trends in the Conterminous United States, 1950–2000. Ecol. Appl. 2006, 15, 1851–1863. [Google Scholar]
- Bruegmann, R. Sprawl, a Compact History; University of Chicago Press: Chicago, IL, USA, 2005. [Google Scholar]
- Tsai, Y.-H. Quantifying Urban Form: Compactness versus ‘Sprawl’. Urban Stud. 2016, 42, 142–161. [Google Scholar] [CrossRef]
- Jaeger, J.A.G.; Schwick, C. Improving the measurement of urban sprawl: Weighted Urban Proliferation (WUP) and its application to Switzerland. Ecol. Indic. 2014, 38, 294–308. [Google Scholar] [CrossRef]
- Jaeger, J.A.G.; Bertiller, R.; Schwick, C.; Kienast, F. Suitability criteria for measures of urban sprawl. Ecol. Indic. 2010, 10, 397–406. [Google Scholar] [CrossRef]
- Bhatta, B.; Saraswati, S.; Bandyopadhyay, D. Urban sprawl measurement from remote sensing data. Appl. Geogr. 2010, 731–740. [Google Scholar] [CrossRef]
- Potter, R.B.; Darmame, K.; Barham, N.; Nortcliff, S. “Ever-growing Amman”, Jordan: Urban expansion, social polarisation and contemporary urban planning issues. Habitat Int. 2009, 33, 81–92. [Google Scholar] [CrossRef]
- Masoumi, H.E.; Hosseini, M.; Gouda, A.A. Drivers of urban sprawl in two large Middle-eastern countries: Literature on Iran and Egypt. Hgeo 2018, 12, 55–79. [Google Scholar] [CrossRef]
- Grădinaru, S.R.; Iojă, C.I.; Onose, D.A.; Gavrilidis, A.A.; Pătru-Stupariu, I.; Kienast, F.; Hersperger, A.M. Land abandonment as a precursor of built-up development at thesprawling periphery of former socialist cities. Ecol. Indic. 2015, 57, 305–313. [Google Scholar] [CrossRef]
- De Espindola, G.M.; da Costa Carneiro, E.L.N.; Façanha, A.C. Four decades of urban sprawl and population growth in Teresina, Brazil. Appl. Geogr. 2017, 79, 73–83. [Google Scholar] [CrossRef]
- Du, J.; Thill, J.-C.; Peiser, R.B.; Feng, C. Urban land market and land-use changes in post-reform China: A case study of Beijing. Landsc. Urban Plan. 2014, 124, 118–128. [Google Scholar] [CrossRef]
- Masoumi, H.E. Urban sprawl in Iranian cities and its differences with the western sprawl. Spatium 2012, 12–18. [Google Scholar] [CrossRef]
- Soltani, A.; Hosseinpour, M.; Hajizadeh, A. Urban Sprawl in Iranian Medium-sized Cities; Investigating the Role of Masterplans. JSD 2017, 10, 122. [Google Scholar] [CrossRef]
- Ghadiri, M. Evaluation expansion small and mid-sized cities in Iran. Geogr. Dev. 2015, 36, 31–48. [Google Scholar]
- Hamidi, S.; Ewing, R. A longitudinal study of changes in urban sprawl between 2000 and 2010 in the United States. Landsc. Urban Plan. 2014, 128, 72–82. [Google Scholar] [CrossRef]
- Salvati, L.; Zambon, I.; Chelli, F.M.; Serra, P. Do spatial patterns of urbanization and land consumption reflect different socioeconomic contexts in Europe? Sci. Total Environ. 2018, 625, 722–730. [Google Scholar] [CrossRef]
- Nassar, A.K.; Alan Blackburn, G.; Duncan Whyatt, J. Developing the desert: The pace and process of urban growth in Dubai. Comput. Environ. Urban Syst. 2014, 45, 50–62. [Google Scholar] [CrossRef] [Green Version]
- He, Q.; Zeng, C.; Xie, P.; Tan, S.; Wu, J. Comparison of urban growth patterns and changes between three urban agglomerations in China and three metropolises in the USA from 1995 to 2015. Sustain. Cities Soc. 2019, 50, 101649. [Google Scholar] [CrossRef]
- Handy, S.; Cao, X.; Mokhtarian, P. Correlation or causality between the built environment and travel behavior? Evidence from Northern California. Transp. Res. Part D Transp. Environ. 2005, 10, 427–444. [Google Scholar] [CrossRef] [Green Version]
- Handy, S.; Boarnet, M.G.; Ewing, R.; Killingsworth, R.E. How the built environment affeects physical activity views from urban planning. Am. J. Prev. Med. 2002, 23, 64–73. [Google Scholar] [CrossRef]
- Pouyanne, G. The influence of urban form on travel patterns. An application to the metropolitan area of Bordeaux. In Proceedings of the 44th Congress of the European Regional Science Association: “Regions and FiscalFederalism”, Porto, Portugal, 25–29 August 2004. [Google Scholar]
- Ewing, R.; Tian, G.; Lyons, T. Does compact development increase or reduce traffic congestion? Cities 2018, 72, 94–101. [Google Scholar] [CrossRef] [Green Version]
- Boarnet, M.G.; Carne, R. Travel by Design: The Influence of Urban Form on Travel; Oxford University Press on Demand: Oxford, UK; New York, NY, USA, 2001. [Google Scholar]
- Ehrlich, M.V.; Hilber, C.A.L.; Schöni, O. Institutional settings and urban sprawl: Evidence from Europe. J. Hous. Econ. 2018, 42, 4–18. [Google Scholar] [CrossRef]
- Koprowska, K.; Łaszkiewicz, E.; Kronenberg, J. Is urban sprawl linked to green space availability? Ecol. Indic. 2020, 108, 105723. [Google Scholar] [CrossRef]
- Lee, C. Metropolitan sprawl measurement and its impacts on commuting trips and road emissions. Transp. Res. Part D Transp. Environ. 2020, 82, 102329. [Google Scholar] [CrossRef]
- Liu, X.; Ou, J.; Chen, Y.; Wang, S.; Li, X.; Jiao, L.; Liu, Y. Scenario simulation of urban energy-related CO2 emissions by coupling the socioeconomic factors and spatial structures. Appl. Energy 2019, 238, 1163–1178. [Google Scholar] [CrossRef]
- Alonso, A.; Monzón, A.; Cascajo, R. Measuring Negative Synergies of Urban Sprawl and Economic Crisis over Public Transport Efficiency. Int. Reg. Sci. Rev. 2018, 41, 540–576. [Google Scholar] [CrossRef] [Green Version]
- Czepkiewicz, M.; Ottelin, J.; Ala-Mantila, S.; Heinonen, J.; Hasanzadeh, K.; Kyttä, M. Urban structural and socioeconomic effects on local, national and international travel patterns and greenhouse gas emissions of young adults. J. Transp. Geogr. 2018, 68, 130–141. [Google Scholar] [CrossRef]
- Figueroa, M.J.; Nielsen, T.A.S.; Siren, A. Comparing urban form correlations of the travel patterns of older and younger adults. Transp. Policy 2014, 35, 10–20. [Google Scholar] [CrossRef]
- Rahnam, M.R.; Wyatt, R.; Heydari, A. What happened from 2001 to 2011 in Melbourne? Compactness versus sprawl. Sustain. Cities Soc. 2015, 19, 109–120. [Google Scholar] [CrossRef]
- Pucci, P. Mobility behaviours in peri-urban areas. The Milan Urban Region case study. Transp. Res. Procedia 2017, 25, 4229–4244. [Google Scholar] [CrossRef] [Green Version]
- Obregón-Biosca, S.A.; Romero-Navarrete, J.A.; Mendoza-Sanchez, J.F.; Betanzo-Quezada, E. Impact of Mobility Induced by Urban Sprawl: Case Study of the Querétaro Metropolitan Area. J. Urban Plan. Dev. 2016, 142, 5015005. [Google Scholar] [CrossRef]
- Acheampong, R.A. Spatial structure, intra-urban commuting patterns and travel mode choice: Analyses of relationships in the Kumasi Metropolis, Ghana. Cities 2020, 96, 102432. [Google Scholar] [CrossRef]
- Osman, T.; Divigalpitiya, P.; Arima, T. Driving factors of urban sprawl in Giza Governorate of Greater Cairo Metropolitan Region using AHP method. Land Use Policy 2016, 58, 21–31. [Google Scholar] [CrossRef]
- Cobbinah, P.B.; Aboagye, H.N. A Ghanaian twist to urban sprawl. Land Use Policy 2017, 61, 231–241. [Google Scholar] [CrossRef]
- Vermeiren, K.; van Rompaey, A.; Loopmans, M.; Serwajja, E.; Mukwaya, P. Urban growth of Kampala, Uganda: Pattern analysis and scenario development. Landsc. Urban Plan. 2012, 106, 199–206. [Google Scholar] [CrossRef]
- Abdullah, J. City Competitiveness and Urban Sprawl: Their Implications to Socio-Economic and Cultural Life in Malaysian Cities. Procedia Soc. Behav. Sci. 2012, 50, 20–29. [Google Scholar] [CrossRef] [Green Version]
- Balaban, O. The negative effects of construction boom on urban planning and environment in Turkey: Unraveling the role of the public sector. Habitat Int. 2012, 36, 26–35. [Google Scholar] [CrossRef]
- Abdulaal, W.A. Large urban developments as the new driver for land development in Jeddah. Habitat Int. 2012, 36, 36–46. [Google Scholar] [CrossRef]
- Hosseini, S.H.; Hajilou, M. Drivers of urban sprawl in urban areas of Iran. Pap. Reg. Sci. 2019, 98, 1137–1158. [Google Scholar] [CrossRef]
- Emadodin, I.; Taravat, A.; Rajaei, M. Effects of urban sprawl on local climate: A case study, north central Iran. Urban Clim. 2016, 17, 230–247. [Google Scholar] [CrossRef]
- Mosammam, H.M.; Nia, J.T.; Khani, H.; Teymouri, A.; Kazemi, M. Monitoring land use change and measuring urban sprawl based on its spatial forms. Egypt. J. Remote Sens. Space Sci. 2017, 20, 103–116. [Google Scholar] [CrossRef] [Green Version]
- Zanganeh Shahraki, S.; Sauri, D.; Serra, P.; Modugno, S.; Seifolddini, F.; Pourahmad, A. Urban sprawl pattern and land-use change detection in Yazd, Iran. Habitat Int. 2011, 35, 521–528. [Google Scholar] [CrossRef]
- Mehriar, M. Urban Sprawl’s Drivers in Iran = Los conductores de la expansión urbana en Irán. Territ. Form. 2019, 50. [Google Scholar] [CrossRef] [Green Version]
- Zali, N.; Ghal’Ejough, F.H.; Esmailzadeh, Y. Analyzing Urban Sprawl of Tehran Metropolis in Iran (During 1956–2011). Anuário IGEO UFRJ 2016, 39, 55. [Google Scholar] [CrossRef]
- Bakhtiari Leili, B.Z. (Ed.) Spatial Analysis of the Extension Pattern of Hamedan City by Shannon Entropy. In Proceedings of the International Conference on Civil Engineering, Architecture & Urban Sustainable Development, Tabriz, Iran, 11–12 December 2013. [Google Scholar]
- Ebrahim, Z.M. The spatial and physical structure of Hamedan. Archeology 2011, 1, 58–82. [Google Scholar]
- Taleshi, M.; Zianoushin, M.M. The physical transformations due to rural sprawl settlements of Hamedan periphery. J. Res. Rural Plan. 2018, 70, 141–160. [Google Scholar]
- Shafiei, M.-A.; Bozorgmehr, K.; Najafi, M.H. (Eds.) Analysis the Pattern of Physical Development Nowshahr. In Proceedings of the Architecture and Sustainable Urban Spaces Conference, Mashhad, Iran, 10–13 December 2013. [Google Scholar]
- Cochran, W.G. Sampling Techniques, 2nd ed.; John Wiley & Sons Ltd.: New York, NY, USA, 1963. [Google Scholar]
- Yeh, A.G.O.; Li, X. Measurement and Monitoring of Urban Sprawl in a Rapidly Growing Region Using Entropy. Photogramm. Eng. Remote Sens. 2001, 67, 83–90. [Google Scholar]
- Nazarnia, N.; Harding, C.; Jaeger, J.A.G. How suitable is entropy as a measure of urban sprawl? Landsc. Urban Plan. 2019, 184, 32–43. [Google Scholar] [CrossRef]
- Nechyba, T.J.; Walsh Randall, P. Urban Sprawl. J. Econ. Prespectives 2004, 18, 177–200. [Google Scholar] [CrossRef] [Green Version]
- Li, G.; Li, F. Urban sprawl in China: Differences and socioeconomic drivers. Sci. Total Environ. 2019, 673, 367–377. [Google Scholar] [CrossRef]
- Persson, Å.; Eriksson, C.; Lõhmus, M. Inverse associations betwwen neighborhood socioeconomic factors and green structure in urban and suburban municipalities of Stockholm county. Landsc. Urban Plan. 2018, 179, 103–106. [Google Scholar] [CrossRef]
- Weilenmann, B.; Schulz, T. (Eds.) Socio-Economic Explanation of Urban Sprwal: Evidence from Switzerland, 1970–2000. In Proceedings of the 54th ERSA Congress, St. Petersburg, Russia, 26–29 August 2014. [Google Scholar]
- García-Palomares, J.C. Urban sprawl and travel to work: The case of the metropolitan area of Madrid. J. Transp. Geogr. 2010, 18, 197–213. [Google Scholar] [CrossRef]
- Zhao, P. Sustainable urban expansion and transportation in a growing megacity: Consequences of urban sprawl for mobility on the urban fringe of Beijing. Habitat Int. 2010, 34, 236–243. [Google Scholar] [CrossRef]
- Crane, R.; Chatman, D.G. Traffic and Sprawl: Evidence from U.S. Commuting, 1985 To 1997. Univ. South. Calif. 2003, 6, 14–22. [Google Scholar]
Figure 1.
Iran, Hamedan, Nowshahr.

Figure 2.
Frequency of some variables in the sample.


Table 1.
Variables.
| Description | Variables |
|---|---|
| Male = 1, Female = 2 | Gender |
| Age | |
| Work and/or study = 1 | Main daily activity |
| No work or study = 2 | |
| Yes = 1, No = 2 | Driving license |
| The number of driving licenses in household | |
| The number of cars in household | |
| Gross monthly income | |
| Number of commuting trips | |
| By car = 2, other mode choice = 1 | Transport mode for commuting trips |
| Number of trips for shopping or entertainment | |
| Outside = 2, inside = 1 | Daily shopping area |
| By car = 2, other mode choice = 1 | Transport mode for shopping/entertainment inside the neighborhood |
| By car = 2, other mode choice = 1 | Transport mode for shopping/entertainment outside the neighborhood |
| Almost never = 2, rarely = 2, a few times per month = 2, a few times per week = 1, every day = 1 | Frequency of public transport use |
| No = 2, yes = 1 | Sense of belonging to neighborhood |
| No = 2, yes = 1 | Attractiveness of shops |
| Far away = 2, inside my neighborhood = 1 | Entertainment place |
| Not attractive = 1, little attractive = 1, acceptably attractive = 2, medium = 1, very attractive = 2 | Quality of social/recreational facilities |
| The house was affordable to buy = 1, the house was to near my work = 2, the surrounding environment is attractive = 1, the house will have higher price = 1, to be near my relatives = 1, l live here since was born = 1 | Residential location choice |
| Length of time living in the current home | |
| From dividing lengths of streets in the catchment area to area of catchment area (catchment area = a circle with 600 m radius for participants, who indicated the nearest intersection to home) | Link density around home |
| From dividing lengths of streets in the catchment area to area of catchment area (catchment area = a circle with 600 m radius for participants, who indicated the nearest intersection to workplace) | Link density around workplace |
| The distance from home to workplace for participants, who pinned the home and workplace in the maps | Commuting distance |
Table 2.
Descriptive statistics of the continuous variables of the sample in Hamedan and Nowshahr.
| Continuous Variables | N | Minimum | Maximum | Mean | Std. Deviation |
|---|---|---|---|---|---|
| Hamedan | |||||
| Age | 493 | 13 | 75 | 34.27 | 12.706 |
| Number of commute trips | 493 | 0 | 28 | 4.15 | 5.209 |
| Number of trips for shopping or entertainment | 492 | 0 | 18 | 2.54 | 2.475 |
| Monthly income for household (euro) | 487 | 100 | 3000 | 595.20 | 304.592 |
| Urban sprawl around home (%) | 500 | 0 | 0.26 | 0.19 | 0.04080 |
| Urban sprawl around workplace (%) | 498 | 0 | 0.59 | 0.20 | 0.17 |
| Link density around home | 500 | 0 | 299 | 184.99 | 57.718 |
| Link density around workplace | 498 | 0 | 592 | 183.57 | 184.5350 |
| Nowshahr | |||||
| Age | 500 | 17 | 87 | 40.90 | 16.48 |
| Number of commute trips | 493 | 0 | 24 | 4.87 | 5.754 |
| Number of trips for shopping or entertainment | 500 | 0 | 10 | 2.75 | 1.824 |
| Monthly income for household (Euro) | 500 | 40 | 3000 | 685.96 | 338.806 |
| Urban sprawl around home (%) | 500 | 0 | 0.30 | 0.19 | 0.05 |
| Urban sprawl around workplace (%) | 305 | 0 | 0.54 | 0.32 | 0.12 |
| Link density around home | 500 | 0 | 1 | 0.40 | 0.123 |
| Link density around workplace | 500 | 0 | 2 | 0.80 | 0.859 |
Table 3.
WLS model for urban sprawl around home in Hamedan.
| Model | Unstandardized Coefficients | Standardized Coefficients | t | p | ||
|---|---|---|---|---|---|---|
| B | Std. Error | Beta | ||||
| 1 | Age | 0.001 | 0.000 | 0.157 | 6.261 | <0.001 |
| Driving license | 0.036 | 0.003 | 0.245 | 10.637 | <0.001 | |
| Number of driving license in household | 0.006 | 0.002 | 0.082 | 3.629 | <0.001 | |
| Number of cars in household | −0.007 | 0.003 | −0.050 | −2.381 | 0.018 | |
| Mode of transportation for commuting trips | 0.008 | 0.004 | 0.058 | 1.996 | 0.047 | |
| Mode choice for shopping/entertainment inside the neighborhood | 0.019 | 0.005 | 0.142 | 4.010 | <0.001 | |
| Mode choice for shopping/entertainment outside the neighborhood | 0.008 | 0.005 | 0.068 | 1.790 | 0.074 | |
| Frequency of public transport use | 0.011 | 0.004 | 0.086 | 2.801 | 0.005 | |
| Sense of belonging to neighborhood | 0.023 | 0.004 | 0.144 | 5.872 | <0.001 | |
| Quality of social/recreational facilities | 0.016 | 0.004 | 0.101 | 3.866 | <0.001 | |
| Model Validation | ||||||
| Model | Sum of Squares | Df | Mean Square | F | p | |
| 1 | Regression | 2983.132 | 10 | 298.313 | 1321.570 | 0.001 |
| Residual | 87.356 | 387 | 0.226 | |||
| Total | 3070.488 | 397 | ||||
| Model Summary | ||||||
| Model | R | R Square | Adjusted R Square | Std. Error of the Estimate | ||
| 1 | 0.986 | 0.972 | 0.971 | 0.4751066 | ||
Table 4.
Weighted Least Square (WLS) model for urban sprawl around workplace in Hamedan.
| Model | Unstandardized Coefficients | Standardized Coefficients | t | p | ||
|---|---|---|---|---|---|---|
| B | Std. Error | Beta | ||||
| 1 | Main daily activity | 0.314 | 0.025 | 0.950 | 12.460 | <0.001 |
| Number of trips for shopping or entertainment per week | −0.004 | 0.002 | −0.044 | −1.993 | 0.047 | |
| Mode choice for shopping/entertainment outside the neighborhood | −0.022 | 0.010 | −0.114 | −2.158 | 0.032 | |
| Residential location choice | 0.046 | 0.016 | 0.160 | 2.823 | 0.005 | |
| Model Validation | ||||||
| Model | Sum of Squares | df | Mean Square | F | p | |
| 1 | Regression | 9067.422 | 4 | 2266.856 | 1049.013 | <0.001 |
| Residual | 639.639 | 296 | 2.161 | |||
| Total | 9707.061 | 300 | ||||
| Model Summary | ||||||
| Model | R | R Square | Adjusted R Square | Std. Error of the Estimate | ||
| 1 | 0.966 | 0.934 | 0.933 | 1.4700143 | ||
Table 5.
WLS model for urban sprawl around home in Nowshahr.
| Model | Unstandardized Coefficients | Standardized Coefficients | t | p | ||
|---|---|---|---|---|---|---|
| B | Std. Error | Beta | ||||
| 1 | Age | 0.001 | 0.000 | 0.102 | 2.669 | 0.008 |
| Main daily activity | −0.052 | 0.021 | −0.265 | −2.516 | 0.012 | |
| Number of cars in household | 0.011 | 0.004 | 0.087 | 2.786 | 0.006 | |
| Monthly income for household | −6.727 × 10⁻⁹ | 0.000 | −0.140 | −4.551 | <0.001 | |
| Number of commute trips per week | −0.002 | .001 | −0.123 | −2.040 | 0.042 | |
| Mode choice for shopping/entertainment inside the neighborhood | 0.011 | 0.005 | 0.092 | 1.993 | 0.047 | |
| Mode choice for shopping/entertainment outside the neighborhood | −0.028 | 0.008 | −0.262 | −3.385 | <0.001 | |
| Sense of belonging to neighborhood | 0.014 | 0.007 | 0.085 | 2.122 | 0.035 | |
| Quality of social/recreational facilities | 0.311 | 0.035 | 1.523 | 8.812 | <0.001 | |
| Commuting distance | −0.695 | 0.113 | −0.147 | −6.140 | <0.001 | |
| Model Validation | ||||||
| Model | Sum of Squares | df | Mean Square | F | p | |
| 1 | Regression | 3.982 | 10 | 0.398 | 707.150 | <0.001 |
| Residual | 0.144 | 256 | 0.001 | |||
| Total | 4.126 | 266 | ||||
| Model Summary | ||||||
| Model | R | R Square | Adjusted R Square | Std. Error of the Estimate | ||
| 1 | 0.982a | 0.965 | 0.964 | 0.0237293 | ||
Table 6.
WLS model for urban sprawl around workplace in Nowshahr.
| Model | Unstandardized Coefficients | Standardized Coefficients | T | p | ||
|---|---|---|---|---|---|---|
| B | Std. Error | Beta | ||||
| 1 | Monthly income for household | 1.088 × 10⁻⁸ | 0.000 | 0.120 | 2.757 | 0.006 |
| Daily shopping area | −0.036 | 0.016 | −0.161 | −2.189 | 0.029 | |
| Frequency of public transport use | −0.030 | 0.014 | −0.126 | −2.119 | 0.035 | |
| Quality of social/recreational facilities | 0.492 | 0.044 | 1.271 | 11.306 | <0.001 | |
| Length of time living in the current home | −0.001 | 0.001 | −0.059 | −1.977 | 0.049 | |
| Commuting distance | −1.072 | 0.373 | −0.122 | −2.873 | 0.004 | |
| Model Validation | ||||||
| Model | Sum of Squares | df | Mean Square | F | p | |
| 1 | Regression | 47.379 | 6 | 7.897 | 459.344 | <0.001 |
| Residual | 4.452 | 259 | 0.017 | |||
| Total | 51.832 | 265 | ||||
| Model Summary | ||||||
| Model | R | R Square | Adjusted R | Std. | ||
| Square | Error of the Estimate | |||||
| 1 | 0.956 | 0.914 | 0.912 | 0.1311141 | ||
Publisher’s Note: MDPI stays neutral with regard to jurisdictional claims in published maps and institutional affiliations. |
© 2020 by the authors. Licensee MDPI, Basel, Switzerland. This article is an open access article distributed under the terms and conditions of the Creative Commons Attribution (CC BY) license (http://creativecommons.org/licenses/by/4.0/).
Share and Cite
MDPI and ACS Style
Mehriar, M.; Masoumi, H.; Mohino, I. Urban Sprawl, Socioeconomic Features, and Travel Patterns in Middle East Countries: A Case Study in Iran. Sustainability 2020, 12, 9620. https://doi.org/10.3390/su12229620
AMA Style
Mehriar M, Masoumi H, Mohino I. Urban Sprawl, Socioeconomic Features, and Travel Patterns in Middle East Countries: A Case Study in Iran. Sustainability. 2020; 12(22):9620. https://doi.org/10.3390/su12229620
Chicago/Turabian StyleMehriar, Melika, Houshmand Masoumi, and Inmaculada Mohino. 2020. "Urban Sprawl, Socioeconomic Features, and Travel Patterns in Middle East Countries: A Case Study in Iran" Sustainability 12, no. 22: 9620. https://doi.org/10.3390/su12229620
Note that from the first issue of 2016, this journal uses article numbers instead of page numbers. See further details here.